In early 2021, Professor Martin Neil and I wrote about the stark difference in trends between the ‘official’ UK Government data on Covid case numbers and the number of 999 (emergency) and other ambulance calls for Covid triage:
In our view, the ambulance data was a far more reliable indicator of Covid illness than the ‘case’ numbers and showed that, while there was a genuine peak in March 2020, there were only small seasonal increases thereafter. This contrasted with the official claims that, for example, during the winter of 2020–21, the number of Covid cases was five times higher than the March 2020 peak.
Consequently, I was intrigued this week when David Scott of UK Column alerted me to some very interesting data provided by Public Health Scotland on the number of cardiovascular incidents involving the ambulance service. From this link, the data is viewable by selecting Cardiovascular from the top menu and then Scottish Ambulance Service from the Select the data you want to explore box.
Data
Although it is possible to search the data by different NHS Scotland reporting regions, I will restrict my analysis to the total for all Scottish reporting regions combined.
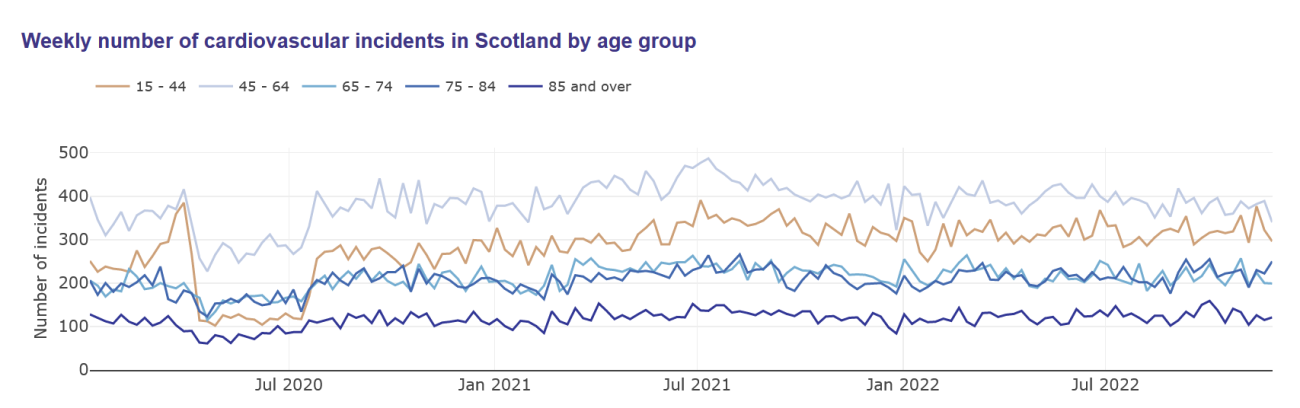
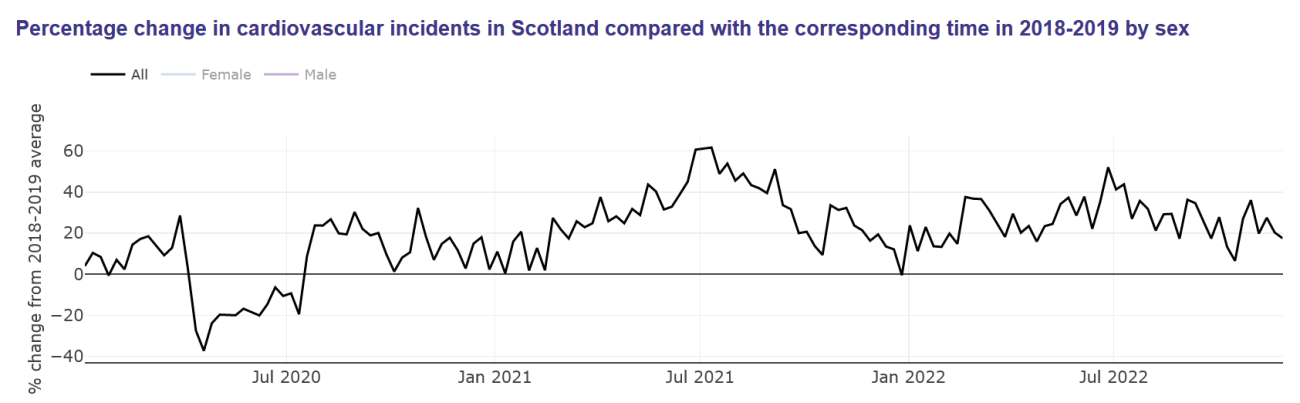
Overall, since mid-August 2020, there has been a significant weekly increase in cardiovascular incidents in Scotland (averaging about 30% higher than the corresponding period in 2018–19), with especially large peaks between May and September 2021 (over 60% higher than the corresponding period in 2018–19):
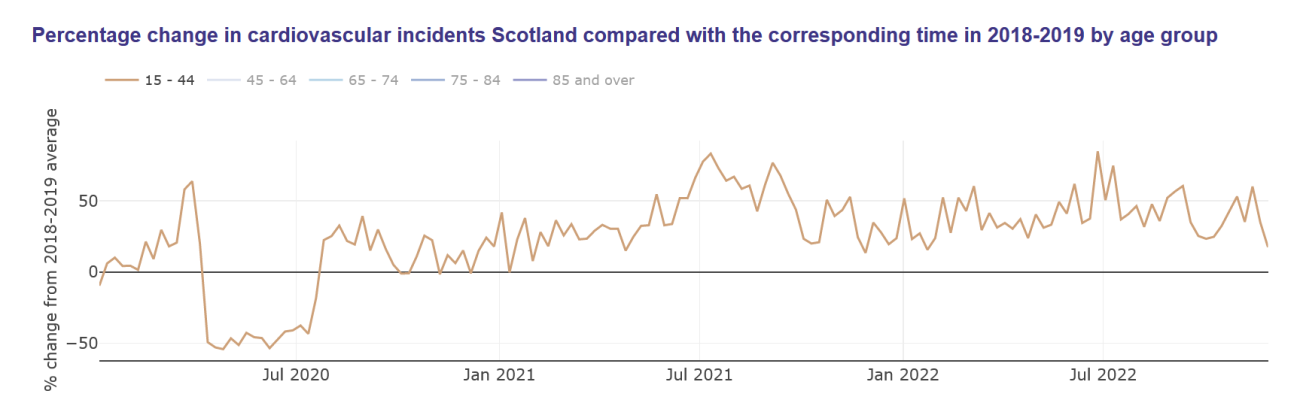
But the differences in age group patterns are interesting, as shown in the following figures (although note that the y-axes are slightly different in each case):
Age 15–44: Main peak around July 2021 (83%) but consistently high since then (average weekly 40% higher) and never below 14% higher:
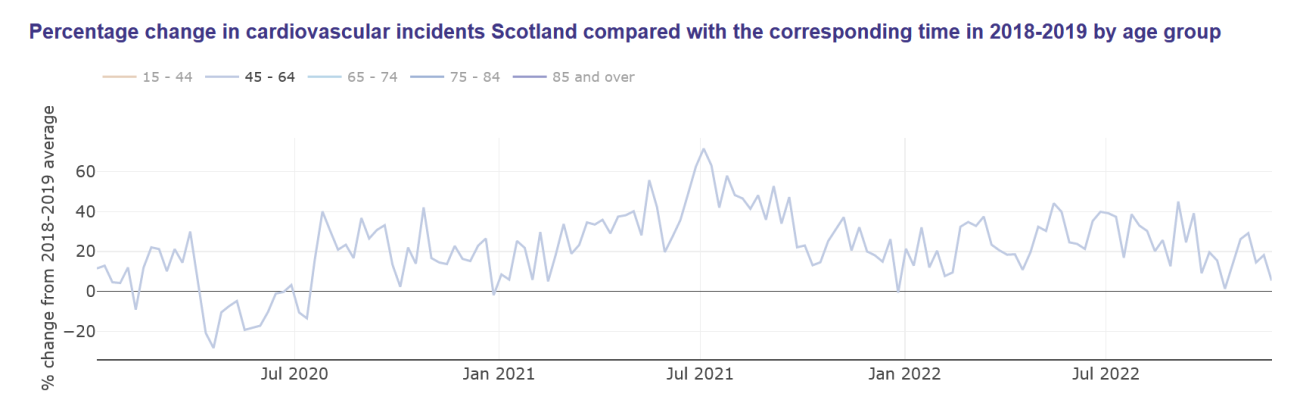
Age 45–64: First peak in May 2021 (56%), highest peak July 2021 (72% increase). Above 0% increases ever since, averaging 28%:
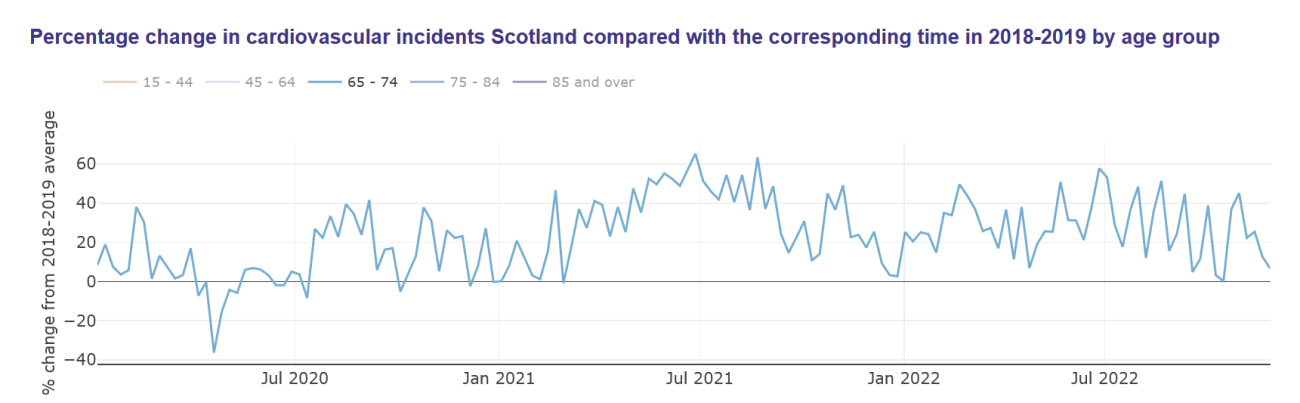
Age 65–74: First peak in February 2021 (47%), highest peak July 2021 (72% increase). Above 0% increases ever since, averaging 25%:
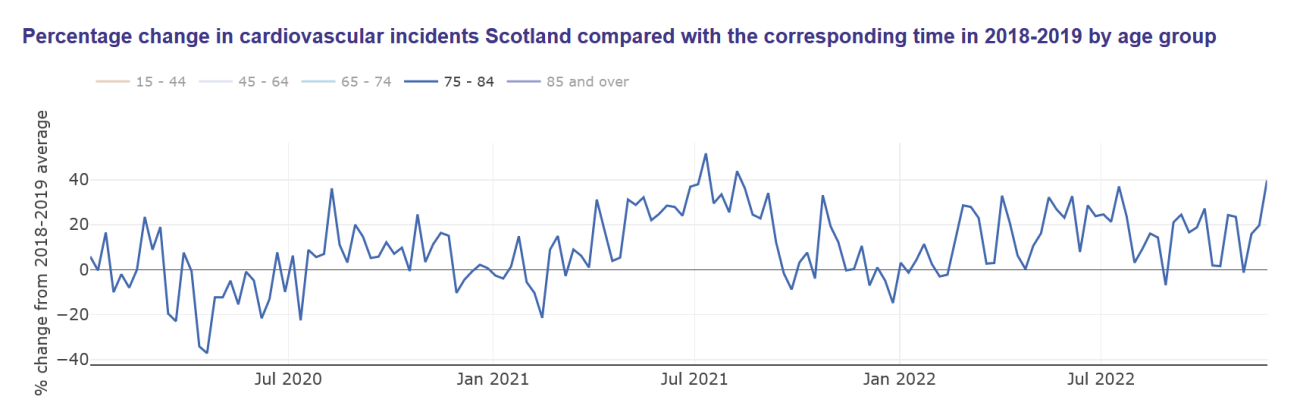
Age 75–84: First peak in April 2021 (34%), highest peak July 2021 (52% increase). Several below 0% since, averaging 16%:
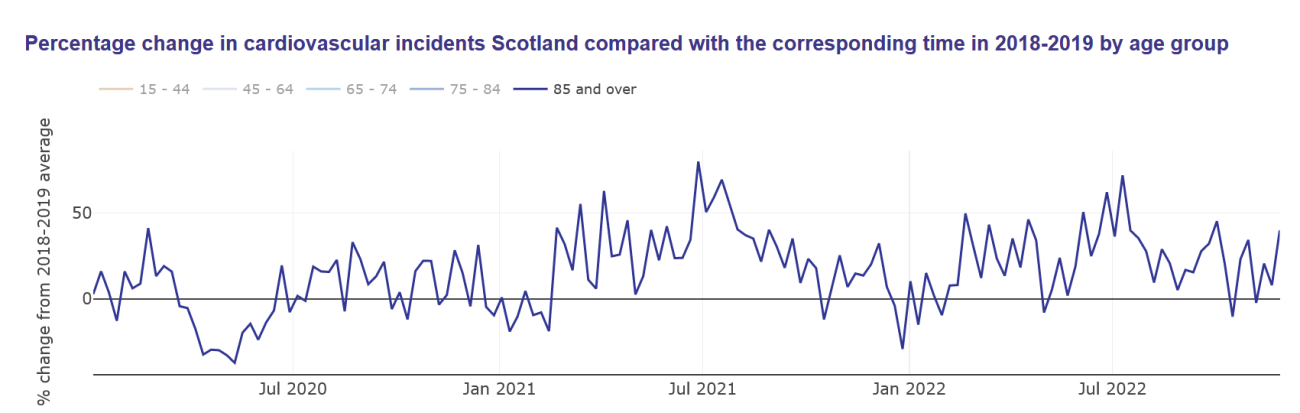
Age 85+: First major peak around Feb 2021 (63%) highest peak July 2021 (80% increase). Several below 0% since, averaging 25%:
As the above graphs have slightly different y-axes, it is useful to directly compare the youngest age group (15–44) with one of the oldest age groups (75–84) on the same axis:
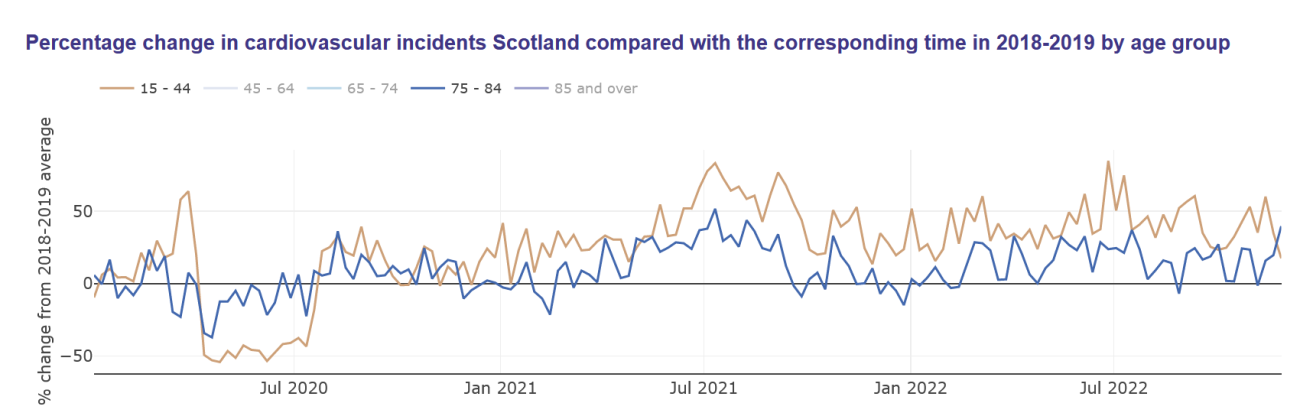
Note that:
- The percentage increases in the young age group have been consistently higher than in the older age group.
- In the young age group, the average weekly increase peaked around July 2021 (83%) but has been consistently high since then (a weekly average of 40% higher than the normal incidence of serious cardiac incidents) and has never fallen below 14% higher.
- In the older age group, the first peak was in April 2021 (34%) and the highest peak was in July 2021 (52% increase). Since then, several months of data in this age group have shown an increase below 0% (i.e., fewer serious cardiac incidents than is normal for the age group) and the monthly data has averaged an increase of 16%.
Significance
So, in summary, it seems:
- The youngest have been proportionally worst affected, with increased rates of serious cardiac incidents.
- There is some evidence of peaks in serious cardiac incidents occurring shortly after vaccination peaks in each of the different age groups.
In case anybody suspects that the differences and large fluctuations are due to chance because of low incident numbers, it is important to note the weekly numbers provided since 2020 in the final chart below.
The oldest age group has the lowest weekly number (averaging around 130 serious cardiac incidents since the start of 2021) while the 45–64 age group has the highest weekly number (averaging around 410 since the start of 2021). These numbers are not small enough to have created the different patterns by chance.