I wish to make clear from the outset that I am not a climatologist but a retired engineer. However, science is based on evidence and argument, and that is what I'm presenting for comment. Furthermore, the line of argument I am presenting utilises the model of historical climate fluctuations assembled from proxy evidence that is accepted by the mainstream in climatology. Thus, it is from the starting point used by the mainstream in climate research that I begin.
The general consensus about carbon dioxide and methane is that they alter Earth's temperature, but I believe that to make the statement that way round is to put matters back to front. This is important to recognise, because decisions have been made which are damaging to the economy and even the environment.
Ice Core Evidence
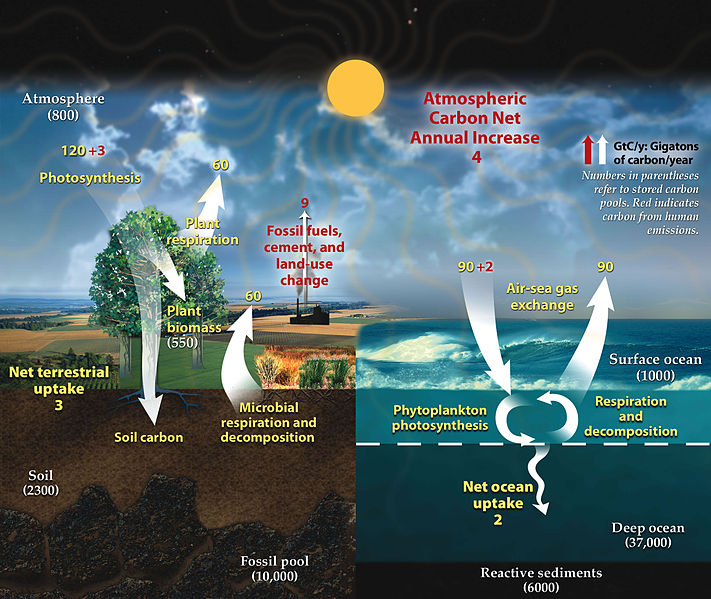
I think the best evidence we have about climate temperature and the level of carbon dioxide and methane comes from ice core samples which date back to 800,000 years ago, together with sedimentary rock covering that period.
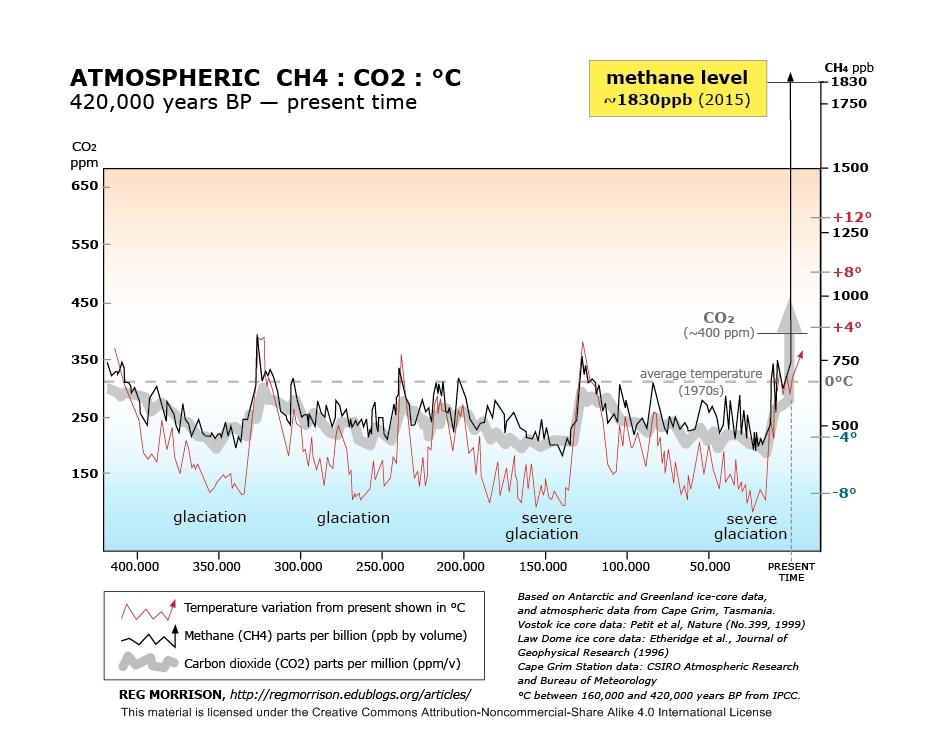
As you can see from the following image going back 420,000 years, you would conclude that climate temperature is either controlled by the levels of these gases or vice versa. So, there are two possibilities.
During that 800,000-year period, the main cause of long-term climate change is Milankovitch cycles: a concept developed by Milutin Milankovitch, a Serbian mathematician, astronomer, climatologist, geophysicist and civil engineer, in the 1930s. Correlations with Milankovitch's figures were made decades later with the study of deep sea sediment cores. These cycles are actually periods where the eccentricity of earth's orbit changes, the inclination of earth's axis varies, and earth's precession continues to wobble.
Earth’s inclination actually gives us our seasons, so when the earth’s axis increases, the seasons become more extreme and the warm summers encourage deglaciation. Each cycle spans 41,000 years.
The earth’s precession can be imagined as a slowly spinning, out-of-balance top. This precession causes the summer and winter to be more extreme in one hemisphere than the other. Each cycle spans 26,000 years.
Earth’s orbit is almost circular, and the variation in its eccentricity over time is actually quite small. However, increased eccentricity does cause variation in Earth's temperature, as you would expect, due to its being alternately closer and further away from the sun.
Such a change from an almost circular orbit will also cause a slight lengthening of some seasons and shortening of others. This cycle spans about 100,000 years (although it varies between 84,000 and 120,000 years) and is thought to have been the dominant one affecting the planet's climate since about 800,000 years ago. Prior to that, up to at least 3 million years ago, it was the 41,000-year cycle that was dominant.
Basically, these variations affect how the earth is warmed by the sun. Incoming solar radiation is referred to as insolation, and Milankovitch’s theory is referred to as orbital forcing. What he mainly focused on was the total summer radiation near to latitude 65º North, where ice sheets had previously formed.
So now, if we look back at the above image showing climate temperature, together with levels of carbon dioxide and methane, we see that climate temperature reaches a maximum spike every 100,000 years or so. This period is determined by the dominant variable: the Milankovitch eccentric cycle. Climate has changed due to these effects, which have nothing to do with methane or carbon dioxide levels. From this, one can only conclude that climate temperature causes changes in carbon dioxide and methane levels, and not the other way around.
I know that only highlighting the 100,000-year cycle does not give a full explanation of how these Milankovitch cycles fit in with the real climate. This simplification does not show the insolation aspect, but it does suffice to demonstrate the relationship between Earth's temperature and those gases.
Possible Arguments
Some may argue that the theory of Milankovitch cycles has to be modified and perhaps cannot explain as much as previously thought. Even if that is the case, when we look at the rise to peak temperature and the corresponding fall every 100,000 years, we know that this can’t just be the result of carbon dioxide and methane levels acting independently.
Others may argue that carbon dioxide causes global warming, even though the effect of orbital forcing was more dominant in the past than today. They may argue that the present higher levels have become more dominant and will therefore cause global warming. However, natural carbon dioxide levels around 3 million years ago were as high as the total levels are now. Earth’s climate was warmer then, with an ice cap only in Antarctica.
Yet the orbital forcing of Milankovitch cycles was still the main factor controlling climate in that era, even though the dominant cycle was then one of 41,000 years. There is no evidence that carbon dioxide or methane levels at that time had taken control of climate variation, but evidence suggests rather that the levels of these gases were simply reacting to higher temperatures. Therefore, when we look at today’s similar carbon dioxide levels, there is no evidence that it is responsible for any global warming. The 3 million-year example shows that orbital forcing is still dominant.
More may argue that carbon dioxide causes global warming, whilst still accepting that carbon dioxide levels are controlled by climate temperature. In their scenario, warming would take place due to increased levels of carbon dioxide, and these levels would further increase as a result of the rising temperature. This in turn would actually cause more warming, resulting in a cascade effect.
A possible argument (one which I have actually heard) is that when warming takes place due to an increase in carbon dioxide, the effect is not significant enough to cause this feedback to kick-in. This is wishful thinking, because when any warming does takes place, the feedback due to rising carbon dioxide levels will kick in no matter how small the temperature increase. That inevitability arises from climate temperature actually being part of the feedback system. So there would always be the tendency for runaway warming if carbon dioxide caused global warming.
Effects of Water Vapour on Climate
What effects do these gases actually have on climate temperature, if any? We are told that water vapour has a more extreme “greenhouse effect” than either carbon dioxide or methane, so humidity is obviously worth considering.
The rather convenient aspect of water vapour for the purposes of our inquiry is that it is not evenly spread throughout the world, so it is possible to compare places which are more humid with others that are drier. Climatologists are concerned about long-term effects, but we can actually check things on a much shorter timescale because night-times tend to be rather cool.
I soon realised that I couldn’t just broadly look at a desert area and then a more humid one in order to make this inquiry, because there are local variations, and because temperature readings can be taken from different locations. So, to ensure consistency, local areas were selected with a good chance of having only one measuring station. The only larger area that I used was Sokoto, Nigeria, which is known to have only one station.
The other criterion was selecting locations with plenty of readings to allow me to select the hottest month or the most humid, and also because having many readings tends to minimise errors. Conveniently, these locations gave the average highest and the average lowest temperatures, so I could avoid any record-breaking years. All the following data shown is for the selected month in each case.
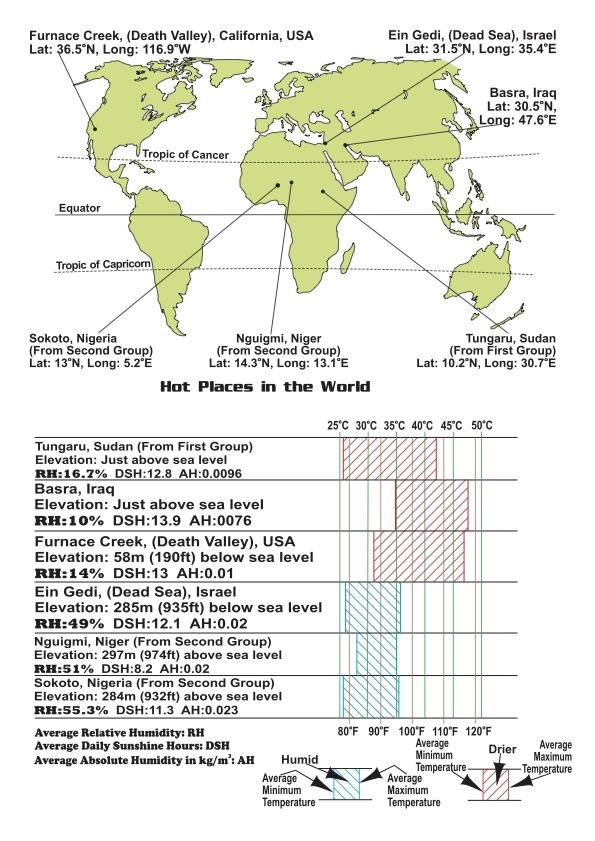
To minimise random weather effects and to amplify differences between humid and dry areas, I wanted the data sites to be ones that have the maximum heat from the sun. Therefore, locations within the tropics and often along the equator were selected, so the sun at its zenith would be directly overhead. In these areas, the length of day and night are rather similar, even during the hottest time of the year, so that ensured consistency between warm days and cool nights. The only exceptions were Basra, Iraq; Furnace Creek (Death Valley), California, USA; and Ein Gedi (Dead Sea), Israel—three non-tropical locations.
Relative Humidity (RH)
There are two aspects of air humidity which had to be included, and they are actually related via temperature and, to a certain extent, via pressure. Relative humidity is easy to visualise by imagining a wet, cloudy, rainy environment as having a high percentage score and a warm, dry, sunny period as being low on the scale.
Having said that, many examples have been included in my data to minimise the cooling effect of cloud, where the humid weather is almost continuous sunshine. To control for this aspect, average daily sunshine hours are included with each example.
Higher relative humidity values turned out to have an effect on air temperature, but not as expected. They tended to narrow the range of temperatures between night and day—but, in the process, also reduced daytime temperatures. Therefore, in nature, relative humidity behaves in the opposite way to a greenhouse gas.
It is tempting to think that the wider temperature range in drier air is quite random and due to a lack of any greenhouse gas capabilities. However, although the range in drier air does vary a little, it is certainly far from random. Two examples—Basra and Furnace Creek (Death Valley), discussed later—emphasise this. I should mention that the sun’s energy over Basra in midsummer is 0.8% lower than in the other examples, and 2.6% lower for Furnace Creek (Death Valley), due to their latitudes being as high as 30.5º and 36.5º North respectively.
Basra is just above sea level and its relative humidity is its lowest at 10% during the hottest month, and that 10% is actually lower than any of the other examples. Nevertheless, the absolute humidity of some selected locations is similar to Basra’s even though they are at a higher elevation. Furnace Creek (Death Valley) has a relative humidity of 14%, which is more typical of the desert locations found, but it is 58 m (190 ft) below sea level. Basra’s and Furnace Creek’s average maximum temperature is higher than those of the other selected locations, but so are the night-time temperatures in these two.
This sufficiently confirms that both dry air and air at an increased pressure/density behave as greenhouse gases.
Absolute Humidity (AH)
Absolute humidity is essentially the mass of water vapour in a unit of volume of air. We have often experienced having warm air in contact with a wet surface: the surface becomes dry (the handdryer effect). The water has transferred into the air, and the absolute humidity will have increased.
For some examples in the more humid areas, the value for absolute humidity did not change when relative humidity decreased. In other cases, absolute humidity did decrease with relative humidity, especially when the locations were desert where values became very low. Again, there was no hint of any greenhouse effect due to water vapour.
Separate Humid and Drier Locations
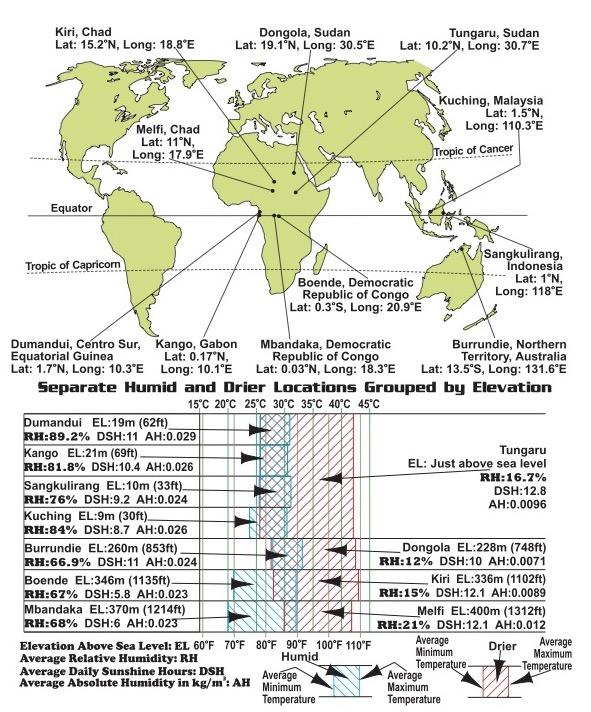
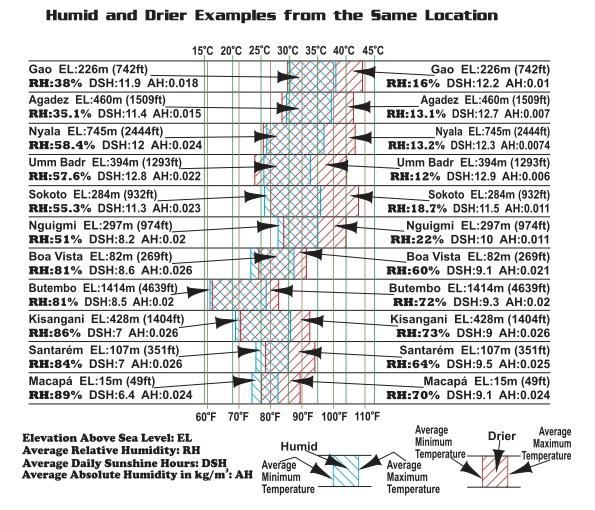
For my first set of examples, I included a range of quite humid locations across the world. I needed to match elevation above sea level of the drier locations with those humid ones, and most of the former were found in the southeastern Sahara Desert area.
Two of my locations—Sangkulirang, Indonesia, and Kuching, Malaysia—are coastal, which could obviously affect the air temperatures if the water was rather cold around these shores. As it turns out, however, sea temperatures near Sangkulirang and Kuching were 29ºC (84.2ºF) and 30ºC (86ºF) respectively. These were similar to the average highest temperatures given, so any cooling effect would be negligible.
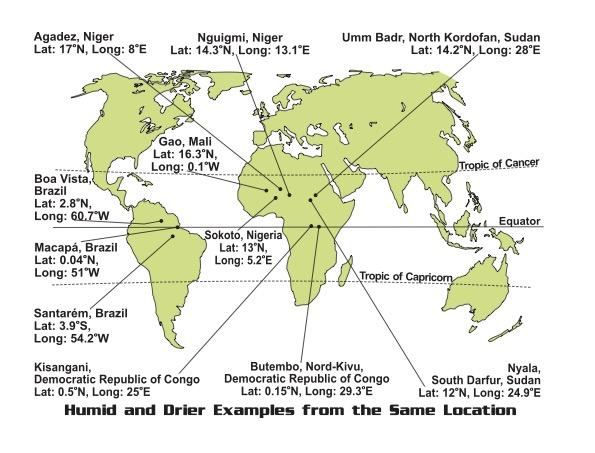
At the risk of having a small difference in temperature between humid and dry conditions, I decided to measure the hot, dry season and the more humid one from the same location. This would have the advantage that the ground heating effects and general temperature measurements would be consistent.
To have the same heat from the sun for both sets of measurements, the inner tropics were chosen, with some of these places quite close to the equator. I then selected data for locations during both their hot, dry month and a high-humidity month, in order to coincide approximately with the sun at its zenith. For those on the equator, this would be approximately late March and late September. The location with the highest latitude was Agadez, Niger, at 17º North, where the sun’s zeniths are given as occurring around early May and mid-August; so even these months are quite well spaced out and suitable.
One location—Macapá, Brazil—is near the sea, and during the hottest month and the most humid the water is 29.8ºC (85.6ºF) and 28.7ºC (83.7ºF) respectively. These are similar to the average highest temperatures given for Macapá, so any cooling effect would be negligible.
One extra factor which I had to bear in mind is that earth’s orbit traces an ellipse. If earth’s distance from the sun was different for each set of readings from the same location, would that have a significant effect?
It will be seen in the map below that three selected locations are in Latin America and the remainder in Africa. We know that on the equator, the sun is at its zenith around both spring and autumn. In Africa, the drier period is in spring and the more humid in autumn; in Latin America, it is the other way around. If there were variation in the sun’s distance and if this had a significant effect, then the highest temperatures would occur at the same time of year on both continents. Instead, the highest temperatures are seen to correspond only with the condition of drier air.
As an aside, by reducing possible inconsistencies in this group, another aspect has been highlighted. From the next examples below, it is evident that the average minimum temperature is similar for both humid and drier conditions. Yet—as with the other groups—the drier average maximum temperature still shows a significant increase.
As mentioned above, increasing relative humidity reduces the greenhouse properties of air. In addition, the Basra and Furnace Creek (Death Valley) data emphasise the greenhouse effect of dry and higher pressure/denser air. Ein Gedi (Dead Sea) temperatures are much lower, despite that location being at a similar latitude to that of Basra.
At Ein Gedi, the sun’s energy is 1% less than in other selected locations, whereas at Basra it is 0.8% lower. Surprisingly, Ein Gedi’s temperatures are actually similar to those of other examples, with a similar relative humidity also, despite its being at a much lower elevation than the rest.
From reports such as Temperature-dependence of the near-UV absorption of water vapor in the 290–350nm range, by Zhe-Chen Wang, Bangsheng Yin, Qilong Min and Lei Zhu, we know that water vapour absorbs energy from that spectrum within the temperature range that is shown in this article. Ein Gedi (Dead Sea) provides perhaps a crude example of near-UV absorption because of the lower sunburn risk, even though there is extensive sunshine there. Yet, despite the obvious energy absorption, the lower temperatures at Ein Gedi demonstrate that water vapour is not acting as a greenhouse gas.
We are told that for greenhouse gases, the science is settled with overwhelming evidence. Yet I can’t help but wonder how the tests to establish these claims were conducted on carbon dioxide and methane. We know that air becomes a more powerful greenhouse gas as it becomes drier, particularly with increased pressure or density.
Concluding questions
Do carbon dioxide and methane behave in the same way as air, especially as regards the effects of water vapour? I suspect they may do, because (I would assume) their behaviour was experimentally determined dry, and possibly at a slightly higher pressure than atmospheric.
Do they behave differently in nature than is assumed in models, as in the case of water vapour?
In short, I have satisfied myself above that water vapour does not act as a greenhouse gas in nature, so it obviously follows to question how realistic the corresponding tests for the properties of carbon dioxide and methane were.
NASA, Global Climate Change: https://climate.nasa.gov/news/2948/milankovitch-orbital-cycles-and-their-role-in-earths-climate/
American Museum of Natural History: https://www.amnh.org/learn-teach/curriculum-collections/earth-inside-and-out/milutin-milankovitch-seeking-the-cause-of-the-ice-ages
Climate Data Information: http://www.climatedata.info/forcing/milankovitch-cycles/
Patrick Tyson: http://www.climates.com/cc/ORBITAL%20FORCING.pdf
Wikipedia: https://en.m.wikipedia.org/wiki/Pliocene_climate
Solar Declination Web: https://gml.noaa.gov/grad/solcalc/solardec.gif
Web (Absolute Humidity): https://planetcalc.com/2167/
Effect of Water Vapour Near UV Absorption: https://www.sciencedirect.com/science/article/abs/pii/S002240732200139X
Humid References:
Web (Dumandui): https://tcktcktck.org/equatorial-guinea/centro-sur/dumandui
Web (Kango): https://tcktcktck.org/gabon/estuaire/kango
Web (Sangkulirang): https://www.weather-atlas.com/en/indonesia/sangkulirang-climate
Web (Sangkulirang Sea): https://weatherspark.com/y/131257/Average-Weather-in-Sangkulirang-Indonesia-Year-Round
Web (Kuching): https://en.climate-data.org/asia/malaysia/kuching/kuching-5122/
Web (Tungaru): https://tcktcktck.org/sudan/south-kordofan/tungaru
Web (Burrundie): https://tcktcktck.org/australia/northern-territory/burrundie
Web (Dongola): https://www.weather-atlas.com/en/sudan/dongola-climate#climate_text_6
Web (Boende): https://www.boende.climatemps.com
Web (Kiri): https://www.worldweatheronline.com/kiri-weather-averages/chari-baguirmi/td.aspx
Web (Kiri): https://geoyp.com/24/kiri-2307304/
Web (Mbandaka): https://www.weather-atlas.com/en/democratic-republic-of-congo/mbandaka-weather-march#climate_text_1
Web (Humidity Mbandaka): http://dev.myweather2.com/City-Town/Democratic-Republic-Of-Congo/Mbandaka/climate-profile.aspx?month=3
Web (Melfi): https://www.weather-atlas.com/en/chad/melfi-climate
Web (Gao): https://www.weather-atlas.com/en/mali/gao-climate
Web (Agadez): https://tcktcktck.org/niger/agadez
Web (Nyala): https://tcktcktck.org/sudan/south-darfur/nyala
Web: (Umm Badr): https://tcktcktck.org/sudan/north-kordofan/umm-badr
Web Umm Badr): https://www.worldweatheronline.com/umm-badr-weather-averages/kurdufan/sd.aspx
Web (Umm Badr): https://elevationmap.net/umm-badda-oum-bada-sd-1011295557
Web (Sokoto): https://tcktcktck.org/nigeria/sokoto
Web (Sokoto): https://www.worlddata.info/africa/nigeria/climate-sokoto.php
Web (Nguigmi): https://www.worldweatheronline.com/nguigmi-weather-averages/diffa/ne.aspx
Web (Nguigmi): https://www.weather2visit.com/africa/niger/nguigmi.htm
Web (Nguigmi): http://www.nguigmi.climatemps.com
Web (Boa Vista): https://en.climate-data.org/south-america/brazil/roraima/boa-vista-3894/
Web (Butembo): https://www.weather-atlas.com/en/democratic-republic-of-congo/butembo-climate
Web (Kisangani): https://www.weather-atlas.com/en/democratic-republic-of-congo/kisangani-climate
Web (Kisangani): https://www.climate-zone.com/climate/congo-democratic-republic/celsius/kisangani.htm
Web (Santarém): https://www.weather-atlas.com/en/brazil/santarem-climate#climate_text_10
Web (Macapá): https://www.timeanddate.com/weather/brazil/macapa/climate
Web (Macapá): https://en.climate-data.org/south-america/brazil/amapa/macapa-4065/
Web (Basra): https://tcktcktck.org/iraq/basra
Web (Furnace Creek): https://www.climatestotravel.com/climate/united-states/death-valley
Web (Furnace Creek): https://en.climate-data.org/north-america/united-states-of-america/california/furnace-creek-690868/
Web (Furnace Creek): https://www.weather-atlas.com/en/california-usa/furnace-creek-climate
Web (Ein Gedi): https://en.climate-data.org/asia/israel/south-district/ein-gedi-202313/
Web (Ein Gedi): https://www.worldweatheronline.com/ein-gedi-weather-averages/hadarom/il.aspx
Web (Ein Gedi Water): https://seatemperature.info/july/dead-sea-water-temperature.html
Web (Ein Gedi): https://www.onthegotours.com/blog/2019/05/facts-about-the-dead-sea/
