In 1991, the French philosopher of postmodernism, Jean Baudrillard, said the Gulf War then being fought in Kuwait and Iraq ‘was not taking place’. What we had consumed, he argued, as we sat at home glued to our television sets, was the simulacrum of a war, a spectacle manufactured by the governments of the West with the almost universal collusion of the media in order to narrativise the geopolitical aggression of the USA and its military allies. Thirty years later, when that collusion has become complete, the more the simulacrum is openly flaunted before us, the more desperate are its consumers to believe its representations—and I don’t only mean those used to justify our imminent declaration of war with Russia. The lies on which we invaded Iraq pale beside those under which we have lived since March 2020, when the World Health Organization declared the ‘pandemic’.
As always—although we appear to have forgotten it along with everything else we knew about the world—the old adage about ‘lies, damned lies and statistics’ holds true to this greatest of all lies: the manufacturing of the coronavirus ‘crisis’ through the cynical and deliberate manipulation of statistics. In this article, which I first published in another version in January 2021, I look at the figures for the mortality rates, places and causes of death in England in 2020, and discuss what they can tell us about what really happened in the first year of the simulacrum of a ‘pandemic’. The figures aren’t conclusive, because the statutory changes to disease taxonomy, protocols for filling in death certificates, criteria for recording deaths, and the deliberately misused testing programme mean we’ll never know how many people actually died from Covid–19 in the UK in 2020; but if we analyse these figures accurately and in their context, it is possible to see some way through the deception to the reality they conceal.
The so-called ‘Lockdown Files’ currently distracting the UK public from the imminent imposition in this country of Digital Identity, 15-minute cities, the WHO’s Pandemic Prevention, Preparedness and Response Treaty and, in the next few years, Central Bank Digital Currency don’t begin to describe the extent to which the ‘pandemic’ was a simulacrum manufactured to justify imposing the regulations, programmes and technologies of the Global Biosecurity State being built around, between and within us. This article goes some way to revealing how the simulacrum was made.
1. Laying the Foundations
Let’s start with the problem of taxonomy. On 5 March 2020, at a time when the UK had attributed one death to Covid–19 and identified 108 ‘cases’ of SARS–CoV–2, the Secretary of State for Health and Social Care, Matt Hancock, made The Health Protection (Notification) (Amendment) Regulations 2020 into law. This first amendment, which would not require resolution by Parliament for forty days from when it returned from its extended recess on 21 April, added Covid–19 and SARS–CoV–2 to the list of, respectively ‘Notifiable Diseases’ and ‘Causative Agents’. Under this change to legislation, medical practitioners have a statutory duty to record Covid–19 on a death certificate—as they do not, for example, with pneumonia, the primary cause of death from respiratory diseases.
On top of these changes, there’s the problem of the criteria for the deceased to be recorded as a ‘Covid–19 death’. On 31 March 2020, the Office for National Statistics (ONS) announced that, in order for a death to be included in its records of ‘Covid–19 deaths’, the disease merely has to be ‘mentioned’ anywhere on the death certificate, without it being ‘the main cause of death’. This included as a ‘contributing’ factor when ‘combined with other health conditions’, or when a doctor has diagnosed a ‘possible’ case of Covid–19 based on ‘relevant symptoms’ but with no test for SARS–CoV–2 having been conducted, or when the deceased tested positive for SARS–CoV–2 but a post mortem hasn’t established the actual cause of death.
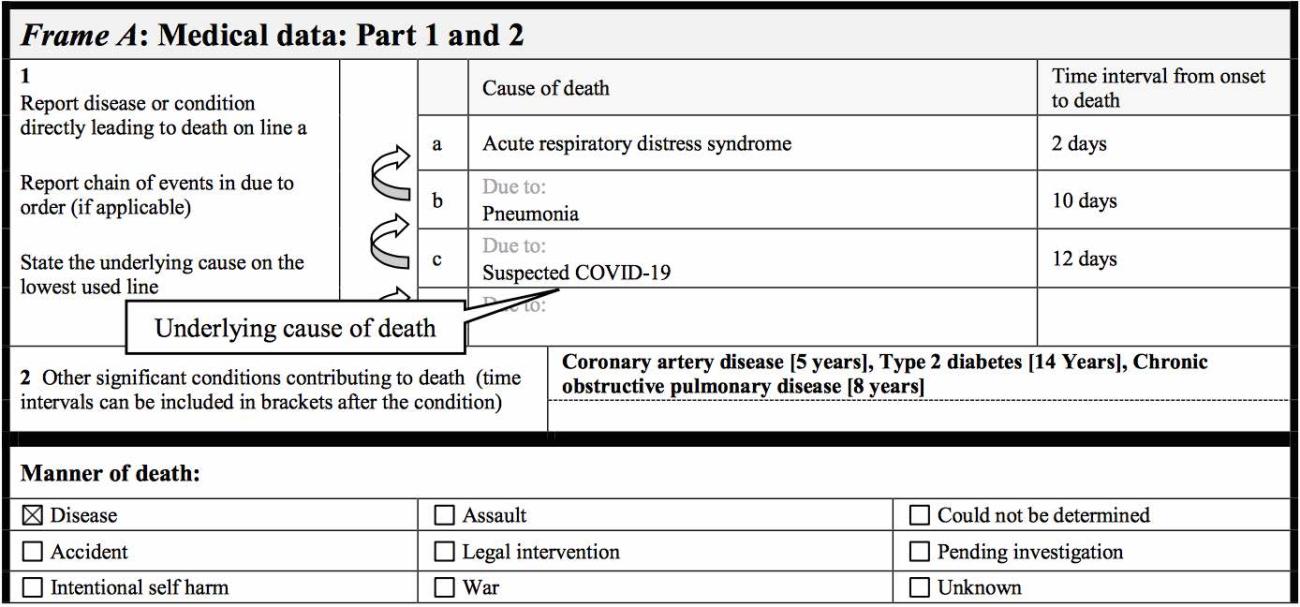
As if this weren’t enough to increase the official tally of deaths attributed to Covid–19 far beyond the numbers of UK citizens that actually died of the disease, there’s the additional problem of the changes to how death certificates record the cause of death. On 20 April 2020, the World Health Organization (WHO) issued the ‘International guidelines for certification and classification (coding) of Covid–19 as cause of death’. These instructed medical practitioners that, if Covid–19 is the ‘suspected’ or ‘probable’ or merely ‘assumed’ cause of death, it must always be recorded in Part 1 of the death certificate as the ‘underlying cause’ of death. In contrast, co-morbidities such as cancer, heart disease, dementia, diabetes or chronic respiratory infections other than Covid–19 should only be recorded in Part 2 of the death certificate as a ‘contributing’ cause.
To clear up any confusion this may cause to a doctor filling out the death certificate of an 80-year-old patient who has died of cancer but tested positive for SARS–CoV–2 post mortem, the WHO instructed medical professionals:
Always apply these instructions, whether they can be considered medically correct or not.
There were other changes to how ‘Covid–19 deaths’ are recorded in the UK, implemented by the National Health Service, Public Health England and the Care Quality Commission, all of which contributed to the inaccuracy of the picture being painted by the Government of the threat of Covid–19; but the three changes above laid the foundation for the ‘crisis’. The tool most responsible for its manufacture, however, was the by now infamous reverse-transcription polymerase chain reaction (RT-PCR) test.
On 17 January 2020, as part of its recommended protocols for RT-PCR tests, the World Health Organization published the Corman-Drosten paper, Detection of 2019 novel coronavirus (2019-nCoV) by real-time RT-PCR. Among the numerous flaws in its catastrophically destructive protocols, the authors recommended using 45 cycles of thermal amplification of swab samples for SARS–CoV–2, which, as numerous studies have confirmed, is many times higher than the number of cycles (no more than 24) at which the specific coronavirus can be identified, infectious virus reliably detected, or its replication into a disease confirmed.
Despite this, these protocols were unquestioningly adopted and repeated across the world, including in the UK. On 16 March, the National Health Service, in its Guidance and standard operating procedure: Covid–19 virus testing in NHS laboratories, recommended a cycle threshold of 45, with anything below 40 to be regarded as a ‘confirmed’ positive. On 28 September, it was estimated that, at even 35 cycles of amplification, 97% of the positives in an RT-PCR test are false. Yet, as late as October 2020, in Understanding cycle threshold (Ct) in SARS–CoV–2 RT-PCR: A guide for health protection teams, Public Health England continued to advise those administering the tests in this country that ‘a typical RT-PCR assay will have a maximum of 40 thermal cycles’, while also conceding that such tests are ‘not able to distinguish whether infectious virus is present’.
To clarify the extent of the deception perpetrated by the use of just this one aspect of these protocols on which the ‘pandemic’ was manufactured, an RT-PCR test at the following cycle thresholds (Ct) amplifies viral DNA this number of times. Ct 24 or less: 16.77 million amplifications (at which it can detect infectious virus); Ct 25: 33.55 million (at which 70% of positive results are ‘real’); Ct 30: 1.07 billion (at which 20% of positives are ‘real’); Ct 35: 34.36 billion (at which 3% of positives are ‘real’); and, finally, Ct 40: 1.09 trillion amplifications (which qualifies, still, as a ‘confirmed positive’ in the UK).
Finally, there is the medically inaccurate equation—which appears to have originated with the media and especially the site Worldometer—of a positive test for SARS–CoV–2 with a ‘case’ of Covid–19. This ignores what Professor Sucharit Bhakdi, Professor Emeritus of Medical Microbiology at the Johannes Gutenberg University Mainz and one of the most referenced scientists in German medical history, in an open letter to the German Chancellor published on 26 March 2020, described as the ‘traditional distinction’ in infectiology between infection with a virus and its replication into a disease identified by its clinical symptoms and not by a fatally flawed test. Despite this, this fundamentally flawed equation has been accepted without question, adopted without commentary and repeated without qualification by every medical body in the UK, and used by the Government to fabricate the vast number of so-called ‘cases’ of Covid–19 on which the biosecurity state has been built with nothing more than traces of a dead virus.
Given these five changes—
- to disease taxonomy;
- to the criteria for attributing a death to Covid–19;
- to identifying the underlying cause of death on a death certificate;
- to identifying infection with SARS–CoV–2; and
- to identifying the clinical presence of Covid–19
—all but one of which were in place before the end of March 2020—how do we establish how many people actually died of Covid–19 in the UK or, to the contrary, how many deaths from cancer, heart disease, dementia, diabetes, influenza and the other primary causes of death in the UK were incorrectly diagnosed and/or recorded as ‘Covid–19 deaths’?
2. Competing Causes of Death
We can start by looking at the other pre-existing health conditions of the tens of thousands of deceased whose deaths, under these changes, were attributed to Covid–19. In July 2020, the Office for National Statistics published data on ‘Pre-existing conditions of people who died with Covid–19’. To qualify as such, a pre-existing health condition had to appear either below Covid–19 in Part 1 on the death certificate, and therefore in the causal chain leading to death, or in Part 2, and therefore as a contributing cause to death if Covid–19 is mentioned in Part 1. Alternatively, if Covid–19 is mentioned in Part 2 of the death certificate, a pre-existing health condition must appear as the underlying cause of death in Part 1.
Following these definitions, the ONS reported that, of the 50,335 deaths attributed to Covid–19 in England and Wales between March and June 2020, 45,859 of the deceased—91.1% of the total—had at least one pre-existing health condition, with a mean average of 2.1 conditions for those aged 0 to 69 years of age and 2.3 for those aged 70 years and over. The most common ‘main’ pre-existing health condition recorded on death certificates in England and Wales was dementia and Alzheimer’s disease, with 12,869 deaths constituting 25.6% of all deaths attributed to Covid–19.
By a ‘main’ pre-existing condition, the ONS means the condition that is most likely to cause death in the absence of Covid–19. In making this distinction, they took their lead from the World Health Organization’s rules for identifying the ‘underlying cause’ of death—which, as we have seen, had been changed to ensure that Covid–19 always appears on death certificates in this category, and in doing so excludes everything appearing above Part 1.
After dementia and Alzheimer’s disease, ischaemic heart diseases were the next most common, with 5,002 death certificates recording it as the ‘main pre-existing health condition’ constituting 9.9% of all deaths attributed to Covid–19. This was followed by influenza and pneumonia, which were present as the main condition on 4,582 death certificates. Of the 50,335 deaths attributed to Covid–19, 4,476 had no main pre-existing health condition on the death certificate—just 8.9% of the total.
But that’s not all. When recording all and not merely the main pre-existing health conditions, their presence on the death certificates of ‘Covid–19 deaths’ was even higher, with 13,840 deaths attributed to Covid–19 having dementia and Alzheimer’s disease also listed, 11,029 ‘Covid deaths’ having influenza and pneumonia, and 9,820 having diabetes.
When I first published this article in January 2021, the Office for National Statistics—extraordinarily, given that we were supposed to be in the middle of an ‘unprecedented’ pandemic—had published no other data on the pre-existing conditions, main and common, of people whose deaths had officially been attributed to Covid–19. So I went instead to the records of the National Health Service. Under what is now the ‘Covid–19 Total Deaths Supplementary Archive’, the file dated 21 January 2021 revealed that 61,414 of the 64,111 deaths in England attributed to Covid–19—over 95% of the total—had at least one pre-existing health condition. Of the remaining 2,697 in which a pre-existing health condition didn’t appear on their death certificate, just 486 were under 60 years of age in the first eleven months of this so-called ‘pandemic’.
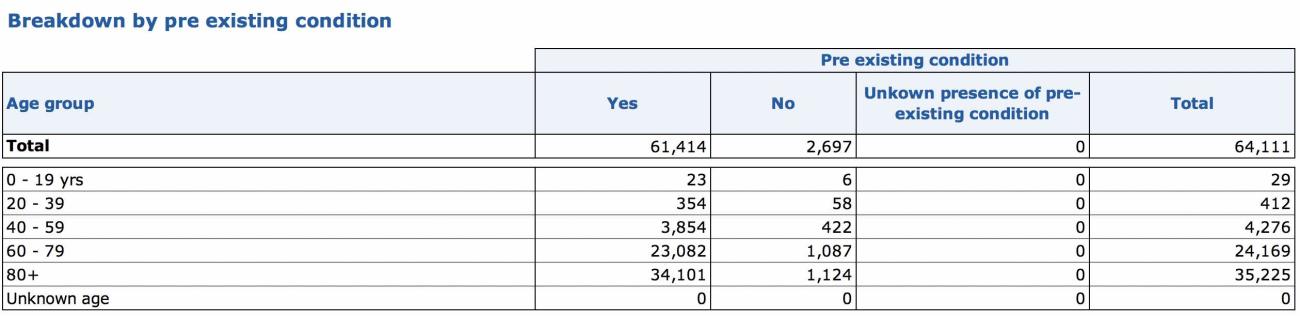
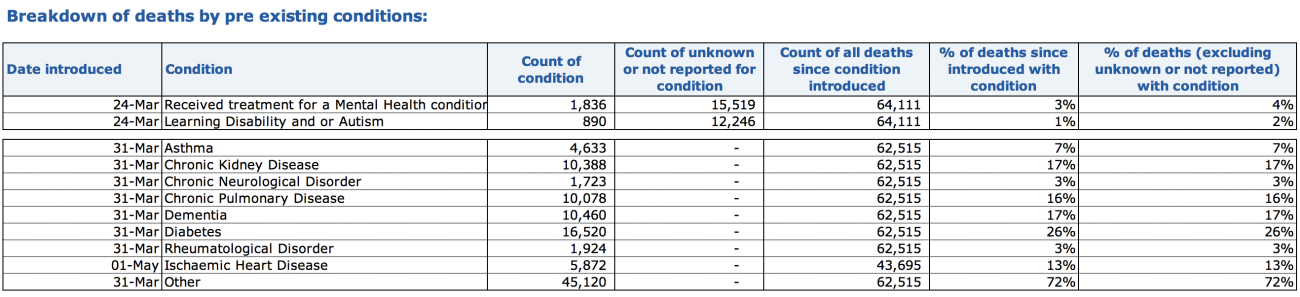
Of those with at least one pre-existing health condition, 26% had diabetes, 17% had dementia, another 17% had chronic kidney disease, 16% had chronic pulmonary disease, 13% had heart disease, and 72% of them had some other health condition. As we have seen, most of the deceased had more than one pre-existing health condition.
What these figures show irrefutably is that less than 5% of the deceased whose deaths in hospital had been attributed to Covid–19 did not have at least one, and usually two or more, health conditions sufficiently life-threatening to appear even on death certificates and records changed to exaggerate the numbers of deaths actually caused by Covid–19. Of course, not everyone dies in hospital, and based on the ONS figures for all deaths attributed to Covid–19 during the first wave of deaths wherever the deceased died, that figure rises to 9%. But together, what these statistics very strongly suggest is that, without the changes to certification and recording, a large percentage of these deaths would not have been attributed to Covid–19 but instead to the primary causes of death in the UK that now appear as the ‘contributing cause’ on their death certificates and the ‘pre-existing condition’ in the official records.
3. Evidence for Lockdown Deaths
In addition to this evidence of systemic misdiagnosis and the wildly inaccurate recording of deaths in 2020, we can also look at the reports and predictions published by various bodies monitoring medical treatment, health and mortality in the UK. These both record and predict the increase in deaths in 2020 not attributed to Covid–19 but resulting from the withdrawal and cancellation of medical diagnosis, treatment and care as a result of the reprioritising of the NHS, of lockdown restrictions, and of the terrorism of the UK population by the Government and media. The figures they report are extraordinary, and cannot easily be explained away.
- In March 2020, the National Health Service made the decision to free up 30,000 of its 100,000 hospital beds for general and acute care, postpone all non-urgent elective operations, and discharge all hospital in-patients who were medically fit to leave. This resulted in up to 25,000 hospital patients being sent into care homes.
- In April 2020, the National Health Service reported a total of 916,581 attendances at Accident and Emergency in England that month, compared with 2,112,165 in the same month the previous year, a reduction of 57%; and only 326,581 emergency admissions, compared with 535,226 in 2019, a reduction of 39%.
- In May 2020, the Office for National Statistics reported that, in the previous month, deaths from dementia and Alzheimer’s disease had increased above the average by 9,429 in England and 462 in Wales. This was 83% higher than usual in England and 54% higher in Wales, with charities reporting that a reduction in essential medical care and family visits was responsible.
- In June 2020, a survey of 128 care homes by the Alzheimer’s Society showed that 79% reported a lack of social contact was causing a deterioration in the health and well-being of residents with dementia, and 75% reported that General Practitioners had been reluctant to visit residents.
- In July 2020, the Office for National Statistics reported that, in March and April alone, there were 16,000 excess deaths not attributed to Covid–19 as a result of changes to emergency care and adult social care under lockdown. The ONS estimated a further 26,000 excess deaths over the rest of 2020 from the same causes, plus a further 1,400 excess deaths resulting from changes to primary and community care, with cancer diagnoses, GP referrals and emergency representations stopped or reduced.
- The same month, the Nursing Times reported that, between March and May, deaths from diabetes at home and in care homes had risen by 47%.
- In August 2020, the Institute of Cancer Research reported that a delay of three months across all 94,912 patients who were due to have surgery to remove their cancer over the course of the year would lead to an additional 4,755 deaths. The report estimated that surgery for cancer affords, on average, 18.1 years of life per patient, of which, on average, one year is lost for a three-month delay, and 2.2 years are lost with a six-month delay.
- In September 2020, Cancer Research UK reported that, in the six months since lockdown, cancer screening had been cancelled for 3.2 million people, and that between March and July there was a 39% drop in the seven key diagnostic tests for cancer in England. It also estimated that, between April and August, around 350,000 fewer people in the UK than normal were referred with suspected cancer symptoms.
- In October 2020, the Office for National Statistics reported that, between March and September, there had been 2,095 excess deaths at home from dementia and Alzheimer’s disease above the five-year average for England and Wales, an increase of 79.3%.
- That same month, the British Heart Foundation reported that, between March and September 2020, there were more than 26,000 excess deaths in private homes across England and Wales, of which there was an increase of 25.9% in deaths from heart disease in England and of 22.7% in Wales.
- In November 2020, the British Medical Journal reported that even a month’s delay in cancer surgery increases the risk of death by 6–13% across all common forms of cancer, with a three-month delay increasing the risk by approximately 25%, rising to 44% for treatments like bowel cancer chemotherapy.
- In December 2020, the National Health Service reported that, in the ten months since March, attendances at Accident and Emergency in hospitals in England were down by 6,887,183 from the same 10 months in 2019, a 32% reduction; and admissions to A&E were down by 1,052,807, a 20% reduction.
- In January 2021, the Journal of the American College of Cardiology, in a study of 66 UK hospitals, reported that during the first lockdown daily admissions for myocardial infarction or heart attack and heart failure decreased by 54%. Admissions recovered to 95% of pre-lockdown levels by June; then fell again between October and November to 41% for heart failure and 34% for heart attacks. In both periods, there was a clear correlation between lockdown restrictions and reduction in medical care.
That this evidence of the devastating effects of lockdown on the health and lives of the UK population, and in particular the elderly and frail, continues to be dismissed by medical professionals unreservedly promoting lockdown in mainstream and social media is concerning, to say the least. But it also shows that emotive reports by doctors apparently addicted to their new-found stardom on Twitter are no basis to policies that, according to these reports, caused the deaths of tens of thousands of UK citizens in 2020 alone.
4. Recovering the Dead
But—comes the response from the Covid-faithful—if these reports and predictions are accurate, wouldn’t the huge increase in deaths show up at the end of the year on the records of overall mortality? Well, let’s take a look. In January 2021, the Office for National Statistics published ‘Deaths registered by place of occurrence’, in which it records, in the accompanying dataset, deaths between 7 March 2020 (week 11 of the year) and 1 January 2021 (week 53)
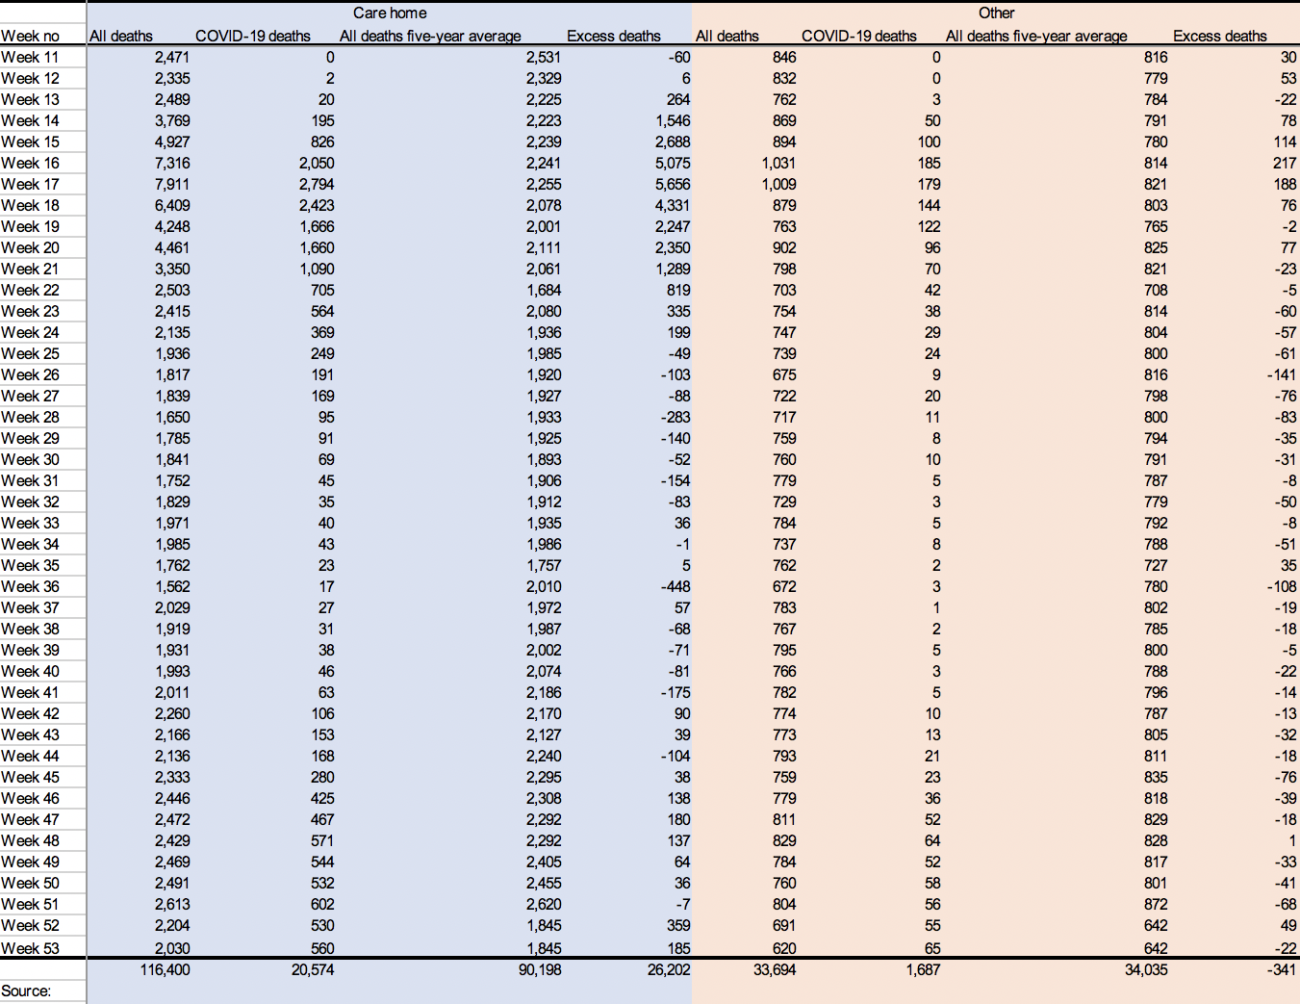
The first statistic that leaps out of these tables is the 40,114 excess deaths over the five-year average that occurred in private homes in the last 43 weeks of 2020, only 3,881 of which were attributed to Covid–19. Even with all the distortions to how these figures have been produced, this still leaves 36,233 excess ‘non-Covid’ deaths at home. In addition, there were 26,202 excess deaths in care homes over the same period. Here, however, 20,574 were attributed to Covid–19, largely on the say-so of the private companies running the homes and without a corroborating medical diagnosis, leaving 5,628 excess deaths. That’s a total of 41,861 deaths above the five-year average unaccounted for. Surely, here is the proof of the human cost of lockdown?
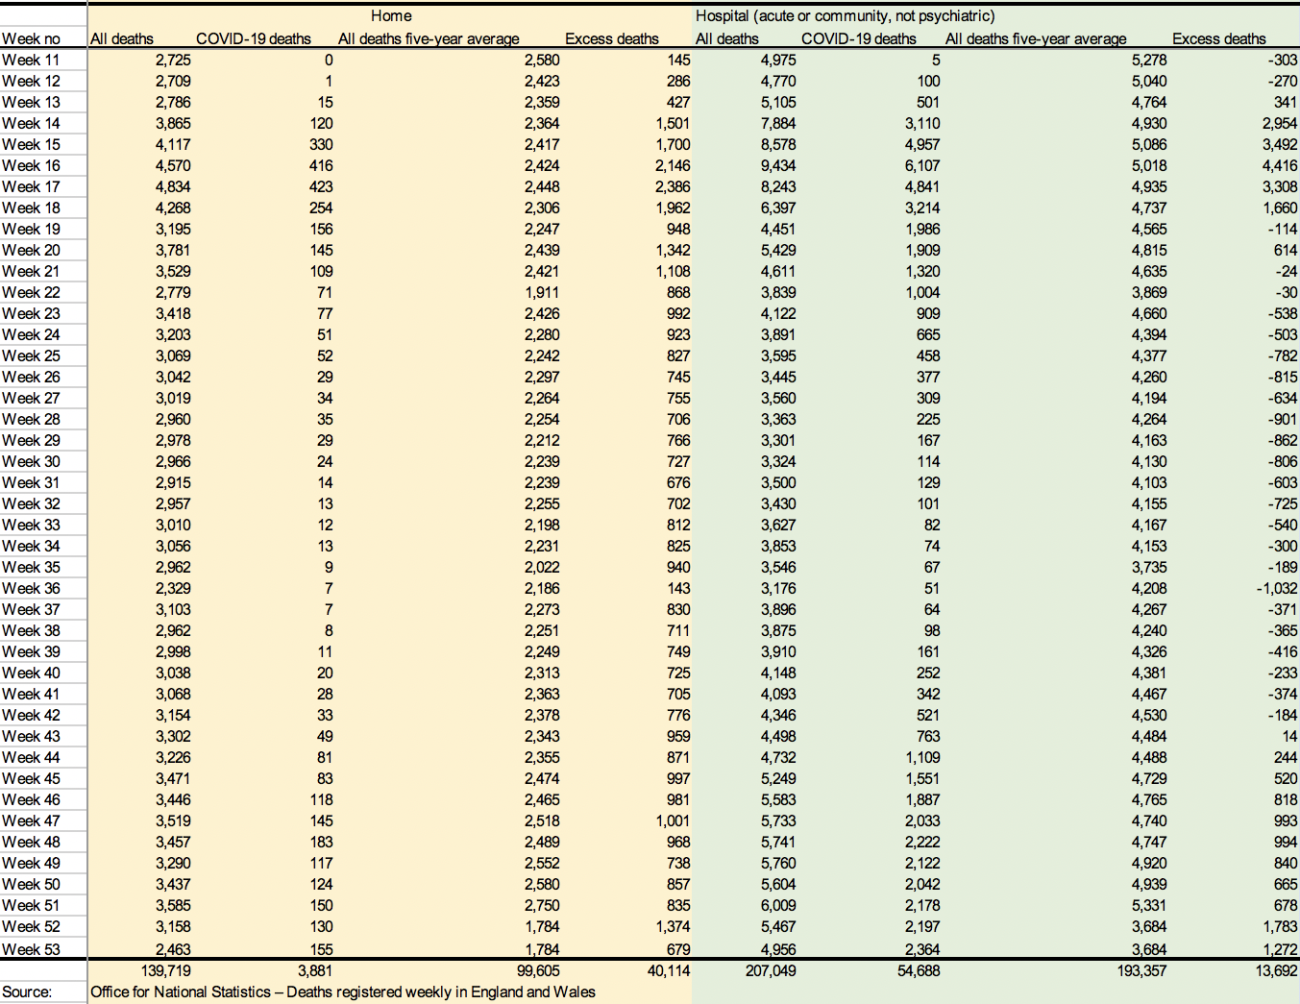
Unfortunately not. If we look at the 207,049 deaths in hospital over the same period, there were 13,692 excess deaths; but 54,688 of these deaths were attributed to Covid–19. That leaves a total of 152,361 deaths attributed to causes other than Covid–19, which is 40,996 fewer than the five-year average. Finally, 33,694 deaths occurred in ‘other’ places than in hospital, at home or in care homes over the same period, of which 1,687 were attributed to Covid–19. That leaves 32,007 deaths from causes other than Covid–19, which is 2,028 fewer than the five-year average of 34,035. In total, therefore, between 7 March 2020 and 1 January 2021, there were 43,024 fewer deaths not attributed to Covid–19 in hospitals and places other than private homes or care homes. That’s only 1,163 more than the 41,861 excess deaths at home and in care homes not attributed to Covid–19.
The picture these figures paint is of slightly fewer people dying outside hospital, as one would expect in a nation under lockdown, and a hugely reduced number of people dying in hospitals, which is also consistent with the withdrawal and reduction of hospital care and the fear of attending hospital created by the Government and media. But according to these statistics, roughly the same number of people appear to have died in 2020 from causes other than Covid–19, but they did so at home, primarily, and in slightly fewer numbers in care homes.
However, such a conclusion relies on a number of suppositions. The first is that the 41,861 people above the five-year average who died outside of hospital from something other than Covid–19, which is almost equalled by the 40,996 fewer deaths inside hospital, would not have lived had they had hospital treatment. But isn’t it reasonable to assume that the huge increase in the deaths at home and in care homes from causes other than Covid–19 wouldn’t have been anywhere near as high if the deceased had had access to hospital care, that not all of them would have simply died in hospital anyway, and in doing so neatly increased the number of hospital deaths to the five-year average? If not, we might wonder what the purpose of hospital treatment is other than palliative care. The figures quoted by the Institute of Cancer Research indicate the contrary: that early diagnosis and treatment make a huge difference to the survival rates of patients; and one would expect a similar reduction in the number of deaths for those suffering from heart disease, dementia and other life-threatening diseases who died at home if they would have been able to access hospital care and treatment.
The second supposition, of course, is the accuracy of the diagnoses of Covid–19 as the cause of death, the protocol for designating Covid–19 as the ‘underlying cause’ on death certificates, and the criteria for recording a ‘Covid–19 death’ on the ONS records. In particular, in April 2020, the Care Quality Commission, the regulator of health and social care in England, introduced what it called a ‘new way’ to understand whether Covid–19 was ‘involved in the death’ of someone in a care home. This merely required a statement from the care home provider that Covid–19 was ‘suspected’ as the cause of death, and which ‘may or may not’ correspond to a medical diagnosis, a positive RT-PCR test result for SARS–CoV–2, or even be reflected in the death certificate. It’s by these criteria that 20,574 deaths in care homes were attributed to Covid–19 in 2020.
Given the deliberately distorted and systemically flawed procedures through which these figures were compiled, they remain, overall, inconclusive in supporting the thesis that lockdown has caused tens of thousands of deaths from causes other than Covid–19. That, no doubt, was the purpose of the changes to taxonomy, protocol and procedure. Nonetheless, they do suggest that the increases in deaths from cancer, heart disease, dementia, diabetes and the other main causes of death in the UK predicted by the various monitoring bodies have been misattributed to Covid–19. But given that the deceased are now gone, and their falsified death certificates are all we have left of the causes of their deaths, how can we find evidence for the manufacture of tens of thousands of ‘Covid–19 deaths’ from their cremated and buried bodies? This is the task of reparation and remembrance with which any true account of 2020 must begin if it is to recover the truth about their deaths from the lies in which they have been shrouded.
5. Overall Mortality in the ‘Epidemic’
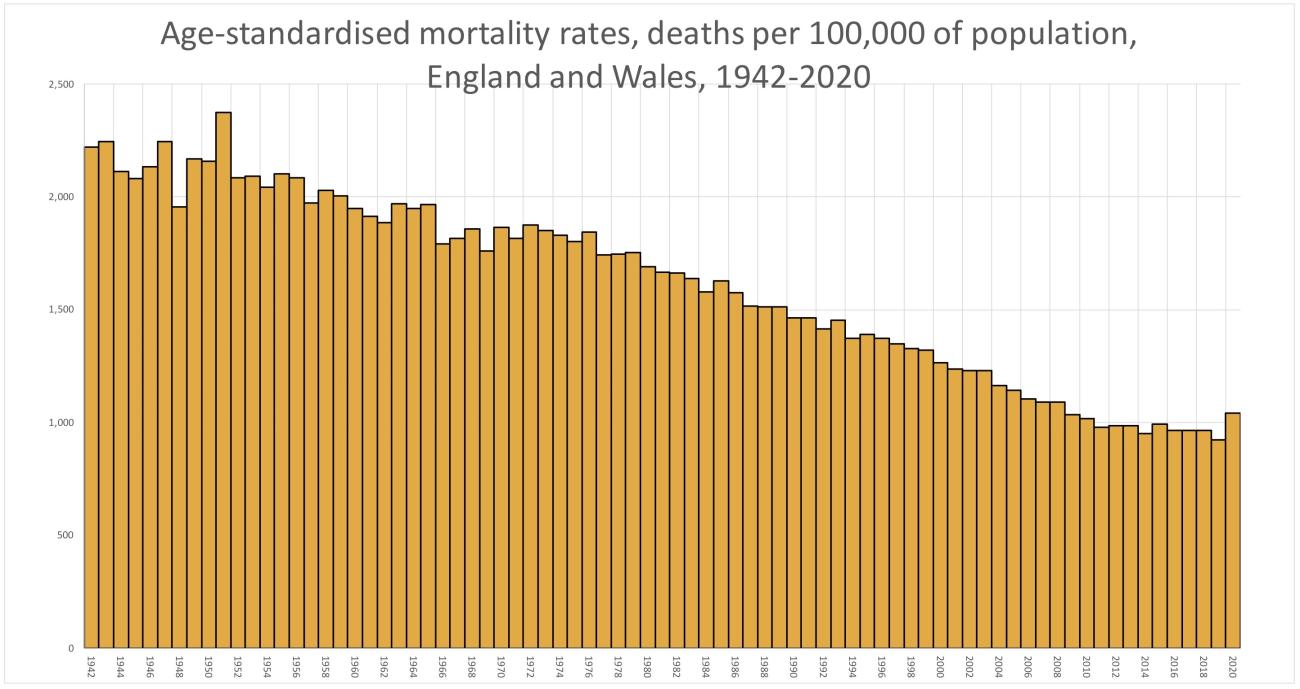
On 12 January 2021, the Head of Mortality Analysis at the Office for National Statistics revealed that mortality rate in the UK in 2020, during a supposedly civilisation-threatening pandemic, had been the worst since . . . 2008. This is based on what the ONS calls its ‘age-standardised mortality rates’, which take account of both increases in population numbers and the ageing of the population, both of which increase the actual number of deaths. In 2008, when the population of England and Wales was 54.84 million, there were 509,090 deaths, compared with 608,002 deaths in 2020, nearly 100,000 more, when the population was 59.83 million, 5 million more. But the overall ageing of the UK population also means that more people can be expected to die in any given year. Between 2009 and 2019, the number of people in the UK aged 65 years and over increased by 22.9% to 12.4 million; the number of people aged 70 years and over increased by 24.7% to 9 million; and the number of people aged 85 years and over increased by 23% to 1.6 million. Taking both these increases into the calculation produces a far more accurate comparison of overall mortality rates between different years.
Fortunately, following a Freedom of Information request, on 12 January the Office for National Statistics published a report on ‘Annual number of deaths, crude and age-standardised mortality rates, deaths registered in England and Wales, 1838 to 2019 (final) and 2020 (provisional)’. This shows that the age-standardised mortality rate in 2020 of 1,043.5 deaths per 100,000 of the population was surpassed not only in 2008 (with 1,091.9 deaths per 100,000), but also in 2007 (1,091.8), in 2006 (1,104.3), in 2005 (1,043.8), 2004 (1,163.0), 2003 (1,232.1), 2002 (1,231.3), 2001 (1,236.2) and 2000 (1,266.4). Unfortunately, the calculation of age-standardised mortality rates for England and Wales only goes back to 1942; but every year between then and 2008 had a higher mortality rate than 2020. In fact, over the last 79 years, 2020 had the 12th lowest mortality rate.
It’s no surprise that mortality rates throughout 2020 were consistently compared to the average over the preceding five years, since those years, as the ONS states, had seen ‘historically low mortality rates’, with 2019 having the lowest rate ever recorded. 2020 was a moderately worse-than-usual year compared to mortality rates over the last decade, but it is by no definition of the term ‘unprecedented’, as we were constantly told by the Government, its medical spokesmen and the media. In reality—rather than in the media—when compared to the history of the UK, at least since the Second World War, the bar-chart below, compiled from the ONS figures, shows that the year 2020 had a historically low mortality rate.
So where does that leave the Covid–19 ‘pandemic’? The calculation of 2020’s historically low mortality rate was based on the statistics published by the Office for National Statistics in January 2021 on the ‘Provisional leading causes of death for 2020’. In the accompanying datasets for the ‘Monthly mortality analysis, England and Wales’, Table 11a shows the age-standardised mortality rate for selected leading causes of death in England between 1 January and 31 December 2020, compared to the five-year average between 2015 and 2019—and what they record deserves the term ‘incredible’.
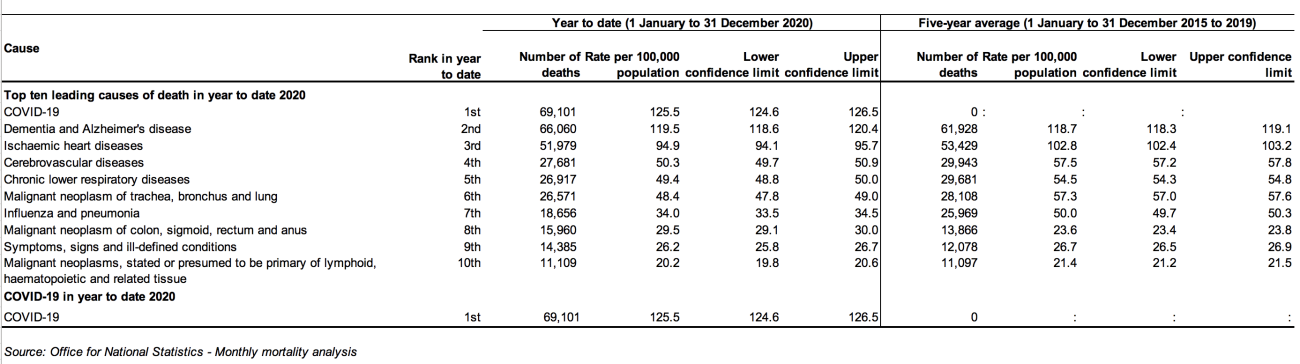
Unsurprisingly, in a year in which 25,000 patients were evicted from NHS hospitals into care homes in which 70% of residents suffer from dementia or severe memory problems, and where the Alzheimer’s Society reported they were denied medical care and family visits under lockdown restrictions, deaths from these diseases in England in 2020 were 4,132 above the five-year average of 61,928 deaths.
Yet, incredibly, in a year in which cancer screening was cancelled for 3.2 million people in the six months up to September 2020 and surgery for 94,912 patients was postponed or cancelled, deaths from lung and throat cancer were down 1,537 from the five-year average of 28,108 deaths.
Just as incredibly, although the British Heart Foundation reported that, between March and September 2020, deaths at home from heart disease were up 25.9% in England due to lockdown restrictions, deaths from heart disease in 2020 were 1,450 below the five-year average of 53,429 deaths.
More incredibly still, deaths from chronic lower respiratory diseases were down by 2,764 from the five-year average of 29,681, a 9% reduction.
And even more incredibly, deaths from cerebrovascular diseases, which cause strokes, aneurysms and haemorrhages, were down by 2,263 deaths from the five-year average of 29,943, a fall of 13.2%.
Most incredibly of all, there were 7,313 fewer deaths from influenza and pneumonia in 2020 than the five-year average of 25,969 deaths, a 28% reduction.
I use the word ‘incredible’ in its proper sense to describe these figures, which are simply not credible as accurate records of the effects of withdrawing and reducing healthcare to nearly 60 million people in England for the best part of ten months. Given the deliberate inaccuracy of the criteria for attributing a death to Covid–19 largely dependent upon a positive test using an RT-PCR test at thresholds where it can identify so-called ‘cases’ of Covid–19 from fragments of dead virus, it is almost impossible that these thousands of ‘lost’ deaths, and the thousands more caused by lockdown, have not been misdiagnosed and/or incorrectly recorded as ‘Covid-deaths’. But how do we corroborate this thesis with facts?
On 14 January, Public Health England published its analysis of ONS figures on deaths over a shorter timeframe, between 21 March 2020 and 1 January 2021, the period during which England had been under various degrees of lockdown restrictions. These show that, even with the WHO’s instructions to medical practitioners that Covid–19 must always be listed as the ‘underlying cause’ of death, a total of 7,511 excess deaths in which other health conditions were listed as such were recorded as ‘Covid–19 deaths’.
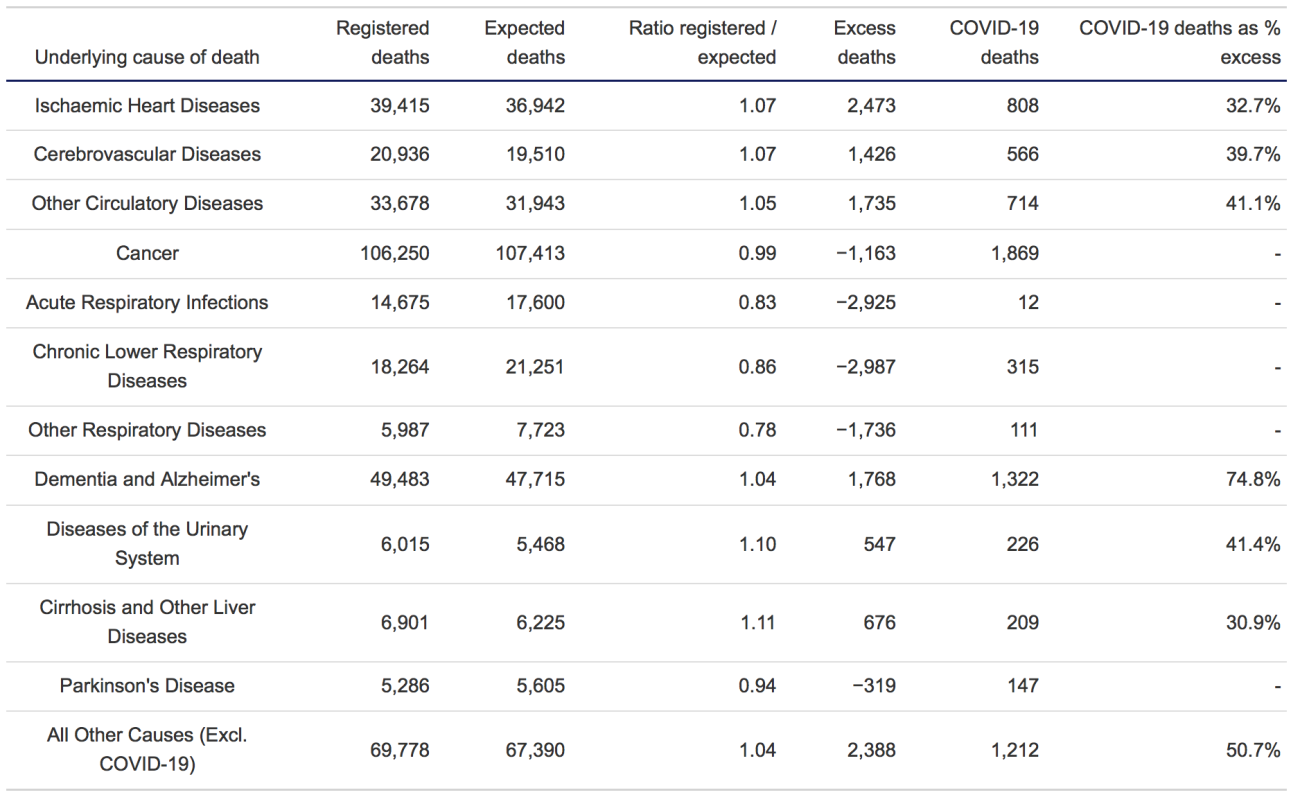
As can be seen, deaths from heart diseases, cerebrovascular diseases, other circulatory diseases, dementia and Alzheimer’s disease, urinary diseases, liver diseases, and from causes other than Covid–19, were 11,013 over the five-year average; yet 5,057 of these were listed as ‘Covid-deaths’. Even when deaths from the underlying cause were below the five-year average, as they were for cancer, acute respiratory infections, chronic lower respiratory diseases, other respiratory diseases and Parkinson’s disease, 2,454 deaths were still registered as ‘Covid–19 deaths’.
Nearly 75% of excess deaths in which dementia and Alzheimer’s disease were listed as the underlying cause were still recorded as ‘Covid–19 deaths’; over 41% of excess deaths from urinary diseases; nearly 40% of excess deaths from cerebrovascular diseases; 41% of excess deaths from other circulatory diseases; 33% of excess deaths from heart diseases; and 31% of excess deaths from liver diseases. While over 50% of excess deaths from all other causes other than Covid–19 were still recorded as Covid–19 deaths.
We should remember that, if Covid–19 had been listed as the ‘underlying cause’ on any of these death certificates, they would all have been recorded as ‘Covid–19 deaths’ by the Office for National Statistics; yet for all these other underlying causes their appearance on the death certificate wasn’t enough to overcome the changes to the ONS criteria for compiling statistics on mortality in the UK. If not quite proof, this is further evidence of a deliberate and very successful attempt to falsify the official tally of ‘Covid–19’ deaths.
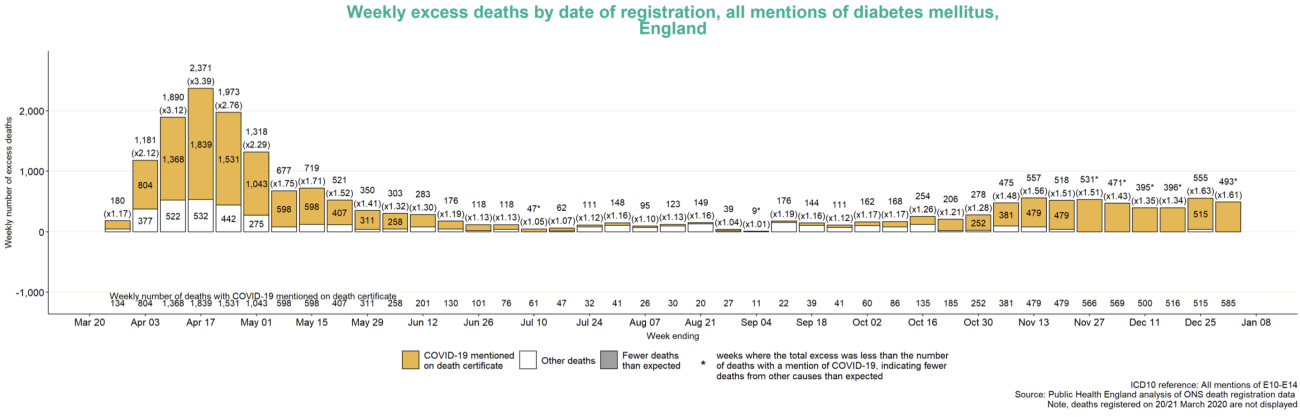
What these figures don’t show, unfortunately, is how many of the deaths from these diseases and illnesses not in excess of the five-year average were also recorded as Covid–19. But Public Health England additionally revealed that, between 21 March 2020 and 1 January 2021, there were 18,851 excess deaths in England in which diabetes was mentioned on the death certificate, of which 15,589 were recorded as Covid–19 deaths, nearly 83% of the total.
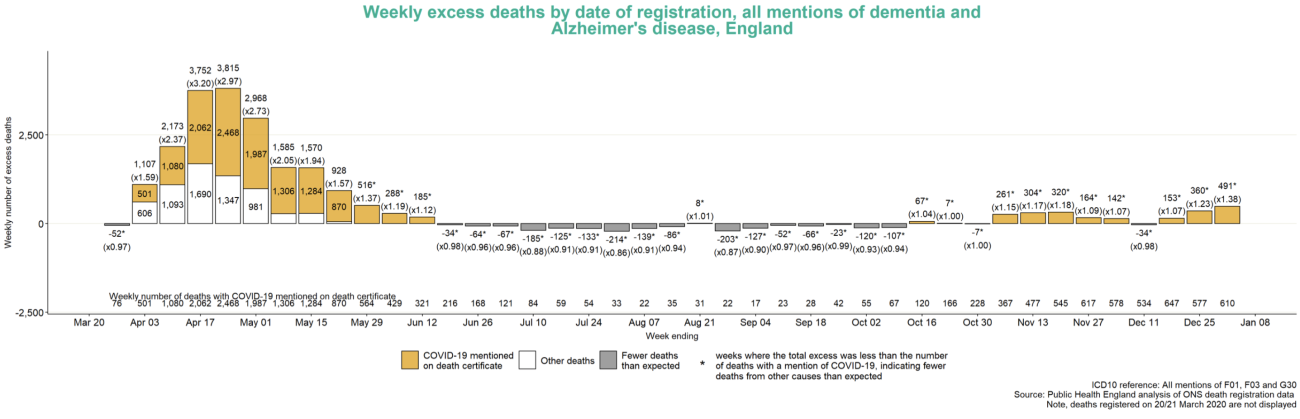
There were also 22,081 excess deaths attributed to Covid–19 in which dementia and Alzheimer’s disease were also mentioned on the death certificate. That’s slightly more than the 20,574 deaths in care homes that were attributed to Covid–19 on nothing more than the suspicion of the care home providers who locked the elderly and confused residents in their rooms and denied them human contact and medical care.
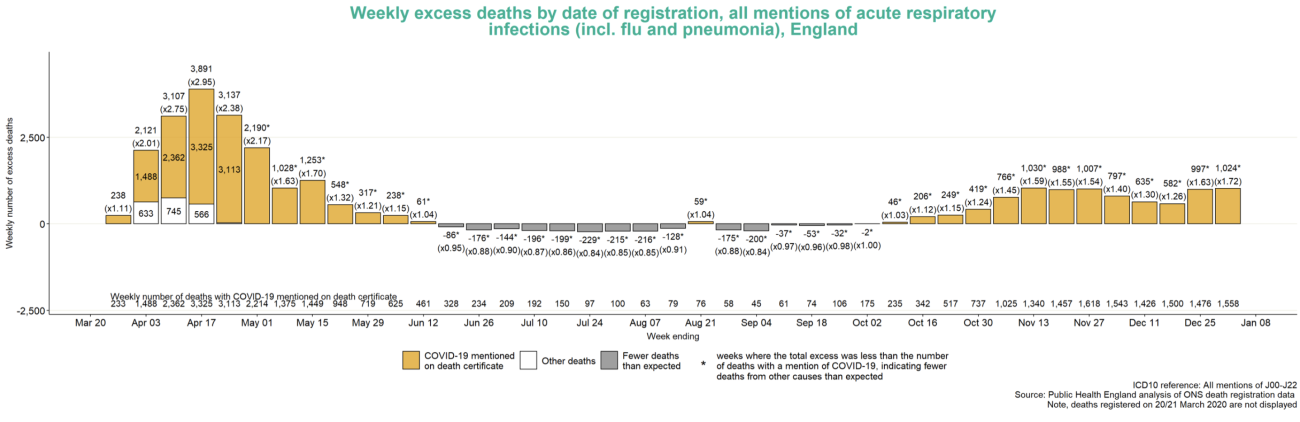
Finally, there were an astonishing 35,133 excess deaths attributed to Covid–19 in which acute respiratory infections, including influenza and pneumonia, were mentioned on the death certificate. If you’re wondering, as many people have been, where all the deaths from flu disappeared to in 2020, here’s your answer.
Indeed, the 76,065 excess deaths in which one or more of these three categories of health conditions appear on the death certificate equal nearly all of the 76,553 deaths in England attributed to Covid–19 in 2020. So why, given the fatality of these causes of death in other years, was Covid–19 recorded as the underlying cause of death on so many of them in 2020?
The most logical answer to that question is the changes to disease taxonomy, to the protocol for completing death certificates, to the criteria for attributing a death to Covid–19, to the false positives produced by the RT-PCR testing programme, and to the equation of such positives with symptoms of Covid–19. To this end, the guidelines for death certification from the World Health Organization about what defines a Covid–19 death are decisive: ‘A death due to Covid–19 may not be attributed to another disease (e.g. cancer)’.
Given these changes—which unlike the number of deaths from Covid–19 truly can be called ‘unprecedented’—we’ll never know how many people actually died of the disease; but these figures give us some indication of the percentage of deaths misdiagnosed as such. What we do know is that, throughout 2020 and into 2021, the British Heart Foundation, the Institute of Cancer Research, the Alzheimer’s Society, the British Medical Journal and other organisations monitoring the nation’s medical treatment, health and mortality all recorded and predicted huge increases in deaths from the withdrawal and reduction of medical care under lockdown restrictions. Mathematically, it’s not possible for the deaths consequent upon these changes to the practices of the National Health Service throughout 2020 not to show up on the records of overall mortality at the end of the year. Yet, if we deduct the 81,653 deaths attributed to Covid–19 from the 608,002 deaths in England and Wales in 2020, we are left with 526,349 deaths from all other causes. That’s 12,734 fewer than the previous five-year average of 539,083 deaths, when, as we have seen, mortality rates have been at historically low levels.
Even with the nearly 5 million fewer diagnoses for cancer, the withdrawn medical care and treatment, the delayed and cancelled operations, the 8,000 fewer hospital beds for general and acute care available due to so-called ‘social distancing’ in hospitals, the medical staff ‘quarantined’ on the basis of false positives on RT-PCR tests, the 7 million people too terrorised by the media to attend hospital, the more than 1 million people who didn’t receive emergency care, and the unrelenting assault on the physical and mental health of the population by medically baseless lockdown restrictions and a media campaign of terror, the number of deaths in 2020, other than those attributed to Covid–19, were lower than they had been since 2016. So the question we have to ask ourselves is: where did all those excess deaths go?
Again, the most logical answer to that question—and the only one that makes sense of these otherwise inexplicable figures—is that they were misdiagnosed or inaccurately recorded as ‘Covid–19 deaths’, and that the only pandemic we suffered, as the historically low mortality rate in 2020 indicates, was a pandemic of tests.
How many have been misdiagnosed? Between 21 March 2020 and 1 January 2021 there were 376,668 deaths in England attributed to causes other than Covid–19. If even 20% of them were misdiagnosed as Covid–19, the 76,553 deaths in England officially attributed to Covid–19 in 2020 would vanish. Perhaps that’s going too far, but given the percentages of excess deaths from underlying causes other than Covid–19 falsely recorded as ‘Covid-deaths’, it’s possible to get a picture of how easy it was to manufacture this ‘crisis’.
7. Conclusions
The rise in excess deaths in April and May 2020, even over the historically low mortality rates of the previous five years, strongly suggests the presence of a disease that, at the least, pushed the already vulnerable to a death that might otherwise have come over the influenza seasons of the previous five years when deaths were, again, very low; or at some other time during 2020, or even in the few years since. But because of the medical profile of the deceased and the age at which they died, this period of concentrated mortality did not contribute, as we would expect of a viral pandemic, to an overall rate of mortality different from those over the past 20 years.
In 2004, for example, the rate of mortality (1,163.0 per 100,000 of the population) was as high above what it was in 2020 (1,043.5) as 2020 was above 2019 (925.0), which had the lowest rate ever. The year before that, 2003, it was even higher (1,232.1). So the exaggerated claims of an ‘unprecedented’ rise in mortality rate from 2019 to 2020 is simply not borne out by the facts. What was different was how, after a period of sustained fall, this rise in overall mortality was explained to a public previously unaware of mortality rates, and what this suddenly increased awareness and fear of our mortality has been used to justify.
84% of the deaths attributed to Covid–19 in 2020, over 68,000 deceased, were of people aged 70 years and over. 61% were aged 80 years and over, the average life expectancy in the UK. Around 90% had at least one pre-existing health condition, with most having two. To put these figures into context, in 2020 there were 9,189,000 people aged 70 years and over in the UK, and 412,408 of them, 4.48%, died of causes not attributed to Covid–19. Just 0.7% of them ‘officially’ died of Covid–19.
It wouldn’t take much to push a population of such elderly and frail people into a life-threatening situation. Lock them up for months on end. Deny them human contact on pain of arrest and fines they couldn’t hope to pay. Withdraw medical treatment. Quarantine their carers. Terrorise them with around-the-clock propaganda about a ‘civilisation-ending’ virus. Order them to stay at home and avoid the contact of other people like the plague. Tell them hospitals, that in reality are standing empty, are on the verge of being overwhelmed. Turn medical centres into places to fear, the breeding grounds of a deadly new disease. That should be more than enough. And it was more than enough. Then, change the medical protocol and criteria for identifying and recording the cause of their deaths, and against all the evidence against its fitness for such use, employ a medically meaningless test to turn traces of a virus that presents no threat to 80% of the population into proof of infection and cause of death. This is how a ‘crisis’ was manufactured. This is how a respiratory virus with the infection fatality rate of seasonal influenza was and continues to be used to justify the regulations, programmes and technologies of the Global Biosecurity State.
Even if lockdown restrictions had been shown to do anything to slow the spread of SARS–CoV–2—and dozens of scientific and medical studies from around the world show that it does not—there is nothing in these figures to justify their imposition and enforcement, or our compliance with them when and where they were. On the contrary, what these figures strongly suggest is that it is precisely these restrictions that were and continue to be responsible for a large proportion of the excess deaths that pushed the mortality rate higher than it had been for a dozen years—and continued to do so into 2021 and 2022.
In my opinion, there is strong evidence to indicate that, at a conservative estimate, at least half the 80,000-plus deaths attributed to Covid–19 in 2020 were caused by lockdown restrictions. The nearly 42,000 excess deaths over the five-year average not attributed to Covid–19 at home and in care homes point towards that figure; as do the more than 43,000 excess deaths estimated to be caused by lockdown by the Office for National Statistics; and the increasingly concerned reports from our various medical bodies about the lack of hospital admissions for the primary causes of death in the UK. But that’s a very conservative estimate. The scandal of more than 20,000 excess deaths in care homes swept under the Covid–19 carpet points towards a far higher number.
But even at 40,000 people dying at the average life expectancy for the UK in 2020, that puts SARS–CoV–2 within the fatality rate of seasonal influenza—as numerous doctors, scientists and modellers not working for the Government or pharmaceutical companies said throughout the year—but without the threat influenza presents to the young, who are statistically immune to SARS–CoV–2.
A year later, on 16 December 2021, in response to a Freedom of Information request—the only way, it appears, to extract some truth from the institutions that have repeatedly lied to the British people—the Office for National Statistics grudgingly revealed that, in the eighteen months between March 2020 and September 2021, deaths attributed to Covid–19 in England and Wales in which the deceased had no pre-existing health conditions numbered 17,371, of which 13,597 (78%) were 65 years of age or older. In Scotland, between March 2020 and November 2021, there were just 884 such deaths, 585 of which (66%) were 70 or over. Even these massive reductions to the official totals aren’t sufficient, however, as under WHO classifications U07.2, U09.9 and U10.9, a death can be attributed to Covid–19 if it is merely the ‘suspected’ cause, occurred from any cause after infection, or is from a multisystem inflammatory cause ‘associated’ with Covid–19.
A month later, in January 2022, the ONS further revealed that, in the 23 months between 1 February 2020 and 31 December 2021, just 6,183 deaths in England and Wales had Covid–19 listed as the only cause on the death certificate. 4,596 of these deaths (75% cent of the total) were of people 70 years of age or older, and 3,388 (55%) were 80 or older, roughly the average life-expectancy in the UK. Just 1,587 people under 70 died with Covid–19 as the only cause of death. Three of them were under 20.
Admittedly, Covid–19 can be responsible for precipitating the death of someone who is already suffering from cancer or heart disease or dementia or some other fatal health condition—over all of which, however, under changes to the certification of deaths in the UK, Covid–19 must always take precedence in identifying the ‘underlying cause’ on the death certificate; so the latter figure of just over 6,000 deaths is not the definitive count over this period. But it and the former figure of around 18,000 deaths in two years point toward the actual impact of Covid–19 on overall mortality in the UK. Neither come anywhere near the nearly 220,000 deaths in the UK officially attributed to Covid–19, which is a lie that will one day rank with the Weapons of Mass Destruction Iraq never possessed.
Back in July 2020, four months into the ‘pandemic’ simulacrum, the Department of Health and Social Care, the Office for National Statistics, the Government’s Actuary Department and the Home Office, in a report titled ‘Direct and Indirect Impacts of Covid–19 on Excess Deaths and Morbidity: Executive Summary’, predicted a further 18,000 excess deaths occurring in the ensuing two to five years due to increased heart disease and mental health problems; 12,500 excess deaths over the next 5 years from changes to elective care, with many non-urgent elective treatments continuing to be postponed or cancelled by the NHS; 15,000 excess deaths among young people just entering the labour market as a result of the lockdown-induced recession; and 17,000 excess deaths for every year that the UK Gross Domestic Product remains low.
Since these predictions were made, the experimental viral-vector and messenger RNA gene therapies that, since December 2020, have been injected into more than 50 million UK citizens as ‘Covid–19 vaccines’ continue to kill thousands, injure millions and have a still unknown but already devastating impact on the UK population. The Institute and Faculty of Actuaries has reported 31,000 excess deaths in England and Wales in 2022. The Office for National Statistics recorded 34,700 more deaths last year than the five-year average before the ‘pandemic’. Finally, the Office for Health Improvement and Disparities has recorded increased death-rates not attributed to Covid–19—even according to the criteria I’ve examined in this article—occurring not in the elderly and sick but in the young and healthy.
The truth is, there was never a question of whether the UK Government would impose another lockdown on the UK in 2021, and in doing so justify the criminal ‘vaccination’ programme. Lockdown wasn’t a consequence of the failure of coronavirus-justified regulations and programmes to stop a deadly new virus: it was the product of their success in creating the conditions—including the deaths of tens of thousands of UK citizens—that justified implementing the UK biosecurity state in which we live today. This is the New Normal we were promised, and it has been built on a foundation of lies, damned lies and statistics.
Simon Elmer is the author of two new volumes of articles on the UK biosecurity state, Virtue and Terror and The New Normal, which are available in hardback, paperback and as an e-book. This article is an extract from an article in Volume 2 entitled ‘Lies, Damned Lies and Statistics: Manufacturing the Crisis’. Please click on these links for the contents pages, introduction and purchase options.